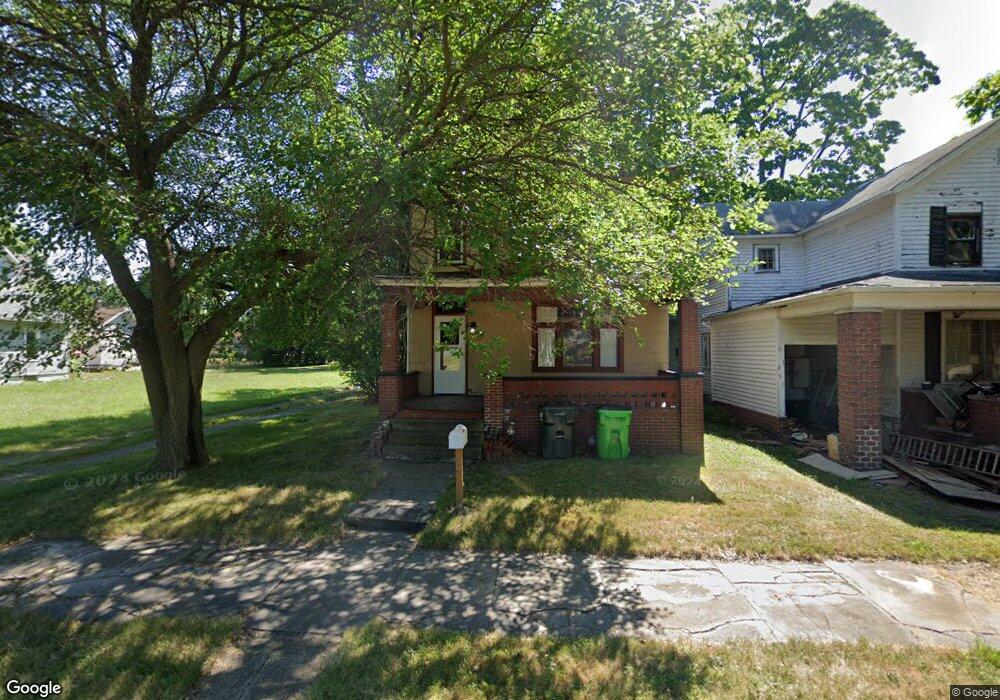
532 S Linden Ave Alliance, OH 44601
Estimated Value: $58,000 - $97,000
4
Beds
1
Bath
2,212
Sq Ft
$33/Sq Ft
Est. Value
About This Home
This home is located at 532 S Linden Ave, Alliance, OH 44601 and is currently estimated at $73,258, approximately $33 per square foot. 532 S Linden Ave is a home located in Stark County with nearby schools including Alliance Intermediate School at Northside, Alliance Elementary School at Rockhill, and Alliance Middle School.
Ownership History
Date
Name
Owned For
Owner Type
Purchase Details
Closed on
Sep 14, 2021
Sold by
Gregory Tanya
Bought by
Mckinzie Bautina
Current Estimated Value
Purchase Details
Closed on
Jan 6, 2021
Sold by
Yeager Richard A and Yeager Tina Jo
Bought by
Gregory Tanya
Purchase Details
Closed on
Mar 15, 2012
Sold by
Yeager Richard A and Yeager Richard
Bought by
Yeager Richard A and Yeager Tina Jo
Purchase Details
Closed on
Oct 11, 2010
Sold by
Trustee Management Servcies Llc
Bought by
Yeager Richard
Purchase Details
Closed on
Apr 14, 2009
Sold by
Mozel Llc
Bought by
Trustee Management Services Llc and 532 Linden Ave Trust
Purchase Details
Closed on
Mar 30, 2009
Sold by
Plymouth Park Tax Services Llc
Bought by
Mozel Llc
Purchase Details
Closed on
Dec 18, 2008
Sold by
Greenfield Properties Inc
Bought by
Plymouth Park Tax Services Llc
Create a Home Valuation Report for This Property
The Home Valuation Report is an in-depth analysis detailing your home's value as well as a comparison with similar homes in the area
Home Values in the Area
Average Home Value in this Area
Purchase History
| Date | Buyer | Sale Price | Title Company |
|---|---|---|---|
| Mckinzie Bautina | $22,200 | None Available | |
| Gregory Tanya | $29,500 | None Available | |
| Yeager Richard A | -- | Attorney | |
| Yeager Richard | $1,000 | None Available | |
| Trustee Management Services Llc | $1,000 | None Available | |
| Mozel Llc | $4,000 | Attorney | |
| Plymouth Park Tax Services Llc | $4,121 | None Available |
Source: Public Records
Tax History
| Year | Tax Paid | Tax Assessment Tax Assessment Total Assessment is a certain percentage of the fair market value that is determined by local assessors to be the total taxable value of land and additions on the property. | Land | Improvement |
|---|---|---|---|---|
| 2025 | -- | $8,900 | $4,030 | $4,870 |
| 2024 | -- | $8,900 | $4,030 | $4,870 |
| 2023 | $1,750 | $7,780 | $2,070 | $5,710 |
| 2022 | $322 | $7,780 | $2,070 | $5,710 |
| 2021 | $852 | $7,780 | $2,070 | $5,710 |
| 2020 | $448 | $10,330 | $1,790 | $8,540 |
| 2019 | $441 | $10,330 | $1,790 | $8,540 |
Source: Public Records
Map
Nearby Homes
- V/L S Freedom Ave
- 223 E Oxford St
- 452 E Summit St
- 442 S Liberty Ave
- 421 S Park Ave
- 900 S Seneca Ave
- 427 S Union Ave
- 62 E Market St
- 955 E Summit St
- 807 S Union Ave
- 1044 S Freedom Ave
- 134 W Cambridge St
- 847 E Patterson St
- 233 W Cambridge St
- 171 1/2 W Main St
- 1245 Jersey St
- 319 W Oxford St
- 1157 Woodland Ave
- 710 N Freedom Ave
- 33 S Lincoln Ave
- 538 S Linden Ave
- 432 E Cambridge St
- 440 E Cambridge St
- 514 S Linden Ave
- 409 E Oxford St
- 443 E Oxford St
- 523 S Linden Ave
- 537 S Freedom Ave
- 435 E Oxford St
- 511 S Linden Ave
- 511 S Freedom Ave
- 549 S Linden Ave
- 545 S Freedom Ave
- 425 E Cambridge St
- 441 E Cambridge St
- 441 E Cambridge St Unit up
- 441 E Cambridge St Unit down
- 461 E Cambridge St
- 535 S Freedom Ave
- 535 S Freedom Ave
Your Personal Tour Guide
Ask me questions while you tour the home.