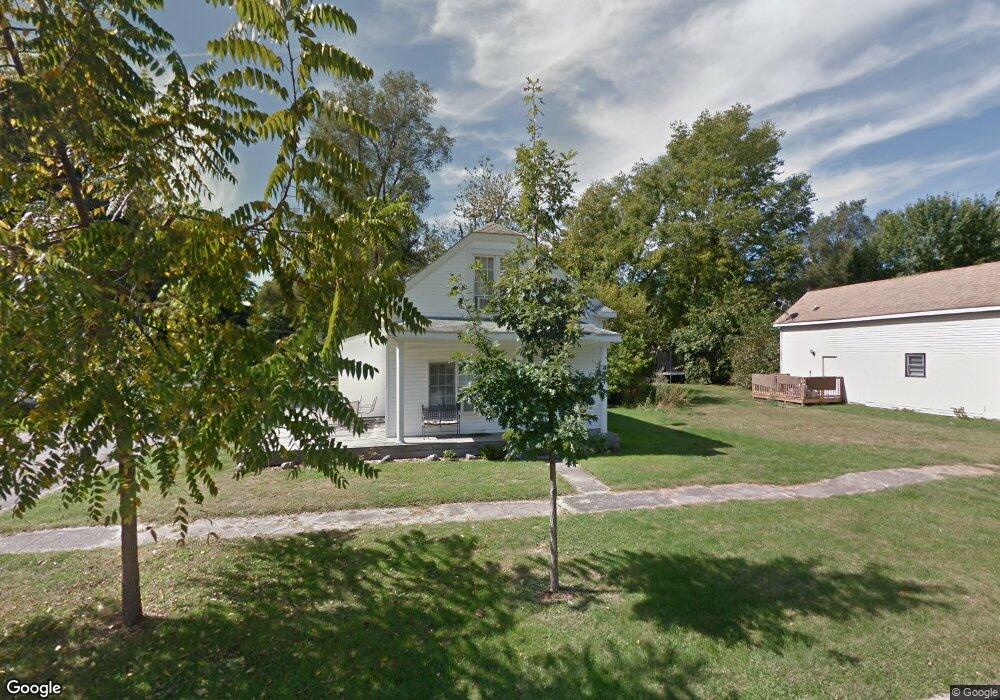
532 S Market St Winamac, IN 46996
Estimated Value: $123,000 - $160,000
3
Beds
1
Bath
1,532
Sq Ft
$92/Sq Ft
Est. Value
About This Home
This home is located at 532 S Market St, Winamac, IN 46996 and is currently estimated at $141,545, approximately $92 per square foot. 532 S Market St is a home located in Pulaski County with nearby schools including Eastern Pulaski Elementary School, Winamac Community Middle School, and Winamac Community High School.
Ownership History
Date
Name
Owned For
Owner Type
Purchase Details
Closed on
Apr 9, 2008
Sold by
Schmicker John
Bought by
Jackson Tara A
Current Estimated Value
Home Financials for this Owner
Home Financials are based on the most recent Mortgage that was taken out on this home.
Original Mortgage
$76,510
Outstanding Balance
$48,969
Interest Rate
6.17%
Mortgage Type
VA
Estimated Equity
$92,576
Purchase Details
Closed on
Oct 16, 2006
Sold by
Beneficial Indian Inc
Bought by
Schmicker John
Purchase Details
Closed on
Feb 8, 2006
Sold by
Knebel Patricia S and Knebel Patricia
Bought by
Beneficial Indiana Inc and Hsbc Mortgage Services
Create a Home Valuation Report for This Property
The Home Valuation Report is an in-depth analysis detailing your home's value as well as a comparison with similar homes in the area
Home Values in the Area
Average Home Value in this Area
Purchase History
| Date | Buyer | Sale Price | Title Company |
|---|---|---|---|
| Jackson Tara A | -- | None Available | |
| Schmicker John | -- | None Available | |
| Beneficial Indiana Inc | -- | None Available |
Source: Public Records
Mortgage History
| Date | Status | Borrower | Loan Amount |
|---|---|---|---|
| Open | Jackson Tara A | $76,510 |
Source: Public Records
Tax History Compared to Growth
Tax History
| Year | Tax Paid | Tax Assessment Tax Assessment Total Assessment is a certain percentage of the fair market value that is determined by local assessors to be the total taxable value of land and additions on the property. | Land | Improvement |
|---|---|---|---|---|
| 2024 | $85 | $78,100 | $12,400 | $65,700 |
| 2023 | $284 | $72,700 | $11,600 | $61,100 |
| 2022 | $268 | $69,300 | $10,800 | $58,500 |
| 2021 | $295 | $72,700 | $10,200 | $62,500 |
| 2020 | $263 | $69,200 | $7,800 | $61,400 |
| 2019 | $172 | $66,700 | $7,800 | $58,900 |
| 2018 | $189 | $66,900 | $7,500 | $59,400 |
| 2017 | $155 | $66,500 | $7,500 | $59,000 |
| 2016 | $155 | $63,700 | $7,200 | $56,500 |
| 2014 | $100 | $61,300 | $7,200 | $54,100 |
| 2013 | $100 | $60,800 | $7,200 | $53,600 |
Source: Public Records
Map
Nearby Homes
- 622 S Market St
- 400 S Market St
- 103 E Washington St
- 449 W Washington St
- 650 U S 35
- 591 U S 35
- 524 N Market St
- 606 N Monticello St
- 614 N Riverside Dr
- 624 N Monticello St
- 610 N Forest Dr
- 436 S 80 E
- 249 E Galbreath Dr
- 253 Galbreath Dr
- 1584 S State Road 119
- 751 N Falvey St
- 800 E Oak View Estate
- 1023 N Monticello St
- 1011 N Agnew St
- 1031 N Agnew St
- 528 S Market St
- 602 S Market St
- 524 S Market St
- 606 S Market St
- 514 S Market St
- 531 S Burson St
- 601 S Burson St
- 525 S Burson St
- 531 S Market St
- 612 S Market St
- 529 S Market St
- 601 S Market St
- 512 S Market St
- 525 S Market St
- 607 S Market St
- 616 S Market St
- 521 S Market St
- 513 S Burson St
- 611 S Market St
- 502 S Market St