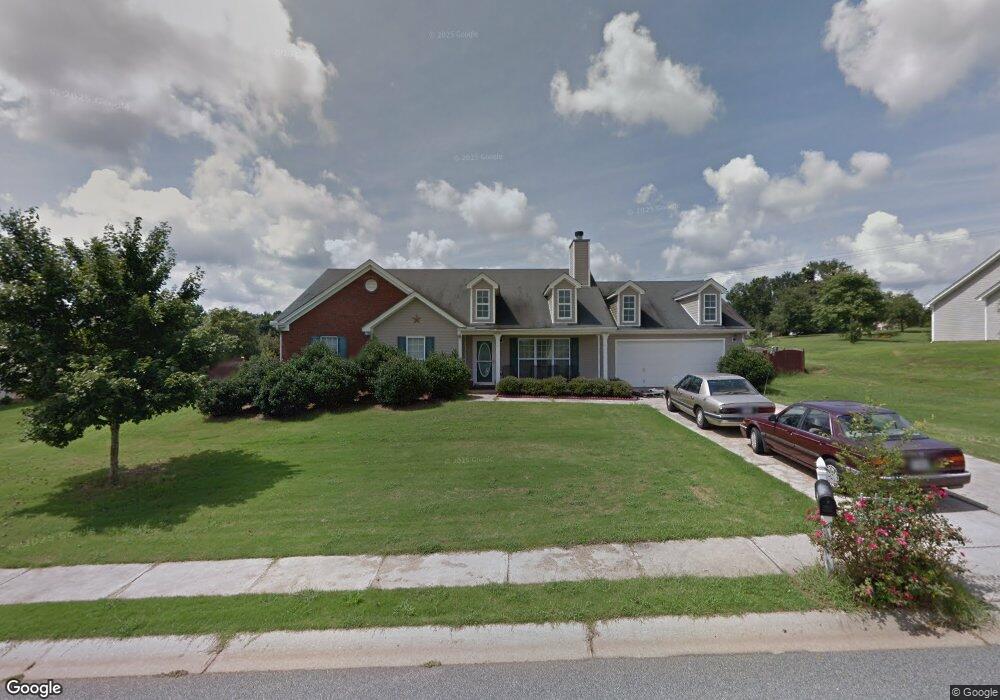
532 Silver Bell Rd Jefferson, GA 30549
Estimated Value: $373,000 - $423,000
4
Beds
3
Baths
3,188
Sq Ft
$126/Sq Ft
Est. Value
About This Home
This home is located at 532 Silver Bell Rd, Jefferson, GA 30549 and is currently estimated at $400,160, approximately $125 per square foot. 532 Silver Bell Rd is a home located in Jackson County with nearby schools including Jefferson Elementary School, Jefferson Academy, and Jefferson Middle School.
Ownership History
Date
Name
Owned For
Owner Type
Purchase Details
Closed on
Jan 8, 2013
Sold by
Johnson Lamar
Bought by
Johnson Mary Francis and Johnson David Lee
Current Estimated Value
Purchase Details
Closed on
Jul 2, 2007
Sold by
Not Provided
Bought by
Johnson Lamar
Home Financials for this Owner
Home Financials are based on the most recent Mortgage that was taken out on this home.
Original Mortgage
$26,700
Interest Rate
6.37%
Mortgage Type
New Conventional
Purchase Details
Closed on
Sep 2, 2005
Sold by
Sabogal Esther
Bought by
Chaparro Ducardo
Purchase Details
Closed on
Jun 29, 2005
Sold by
Chaparro Ducardo
Bought by
Chapparo Ducardo and Sabogal Esther
Home Financials for this Owner
Home Financials are based on the most recent Mortgage that was taken out on this home.
Original Mortgage
$139,410
Interest Rate
5.54%
Mortgage Type
New Conventional
Purchase Details
Closed on
Aug 26, 2004
Sold by
Galaxy Dev Llc
Bought by
Star Home Builders Inc
Create a Home Valuation Report for This Property
The Home Valuation Report is an in-depth analysis detailing your home's value as well as a comparison with similar homes in the area
Home Values in the Area
Average Home Value in this Area
Purchase History
| Date | Buyer | Sale Price | Title Company |
|---|---|---|---|
| Johnson Mary Francis | -- | -- | |
| Johnson Lamar | $169,900 | -- | |
| Chaparro Ducardo | -- | -- | |
| Chapparo Ducardo | -- | -- | |
| Chaparro Ducardo | $154,900 | -- | |
| Star Home Builders Inc | $760,000 | -- |
Source: Public Records
Mortgage History
| Date | Status | Borrower | Loan Amount |
|---|---|---|---|
| Previous Owner | Johnson Lamar | $26,700 | |
| Previous Owner | Chaparro Ducardo | $139,410 |
Source: Public Records
Tax History
| Year | Tax Paid | Tax Assessment Tax Assessment Total Assessment is a certain percentage of the fair market value that is determined by local assessors to be the total taxable value of land and additions on the property. | Land | Improvement |
|---|---|---|---|---|
| 2025 | $3,552 | $129,400 | $21,240 | $108,160 |
| 2024 | $3,552 | $129,400 | $21,240 | $108,160 |
| 2023 | $3,567 | $118,120 | $21,240 | $96,880 |
| 2022 | $3,220 | $100,160 | $21,240 | $78,920 |
| 2021 | $3,083 | $94,200 | $15,280 | $78,920 |
| 2020 | $2,869 | $81,880 | $15,280 | $66,600 |
| 2019 | $2,767 | $77,800 | $11,200 | $66,600 |
| 2018 | $2,672 | $74,560 | $11,200 | $63,360 |
| 2017 | $2,507 | $68,558 | $13,200 | $55,358 |
| 2016 | $2,192 | $59,658 | $13,200 | $46,458 |
| 2015 | $2,098 | $56,858 | $10,400 | $46,458 |
| 2014 | $1,624 | $43,594 | $10,400 | $33,194 |
| 2013 | -- | $43,593 | $10,400 | $33,193 |
Source: Public Records
Map
Nearby Homes
- 345 Hickory Hills Dr
- 273 Hickory Hills Dr
- 249 Forest St
- 1681 Jett Roberts Rd
- 955 Georgia 82 N
- 194 Georgia 82 N
- Tract 1 Georgia 82 N
- 1362 Washington St
- 222 Jett Roberts Rd
- 66 Highland Dr
- 185 Jimmy Reynolds Dr
- 0 Jett Roberts Rd Unit LOT 2
- 0 Jett Roberts Rd Unit 7732053
- 865 Elder Dr
- 470 Katherine Dr
- 445 Katherine Dr
- 206 Blue Dragon Dr
- 53 Adventure Trail
- 50 Elder Dr
- 567 Storey Ln
- 560 Silver Bell Rd
- 512 Silver Bell Rd
- 523 Silver Bell Rd
- 555 Silver Bell Rd
- 507 Silver Bell Rd
- 574 Silver Bell Rd
- 486 Silver Bell Rd
- 597 Silver Bell Rd
- 586 Silver Bell Rd
- 471 Silver Bell Rd
- 27 Holly Ct
- 209 Helene Way
- 221 Helene Way
- 631 Silver Bell Rd
- 142 Persimmon Dr
- 170 Persimmon Dr
- 628 Silver Bell Rd
- 41 Holly Ct
- 435 Silver Bell Rd
- 116 Persimmon Dr
Your Personal Tour Guide
Ask me questions while you tour the home.