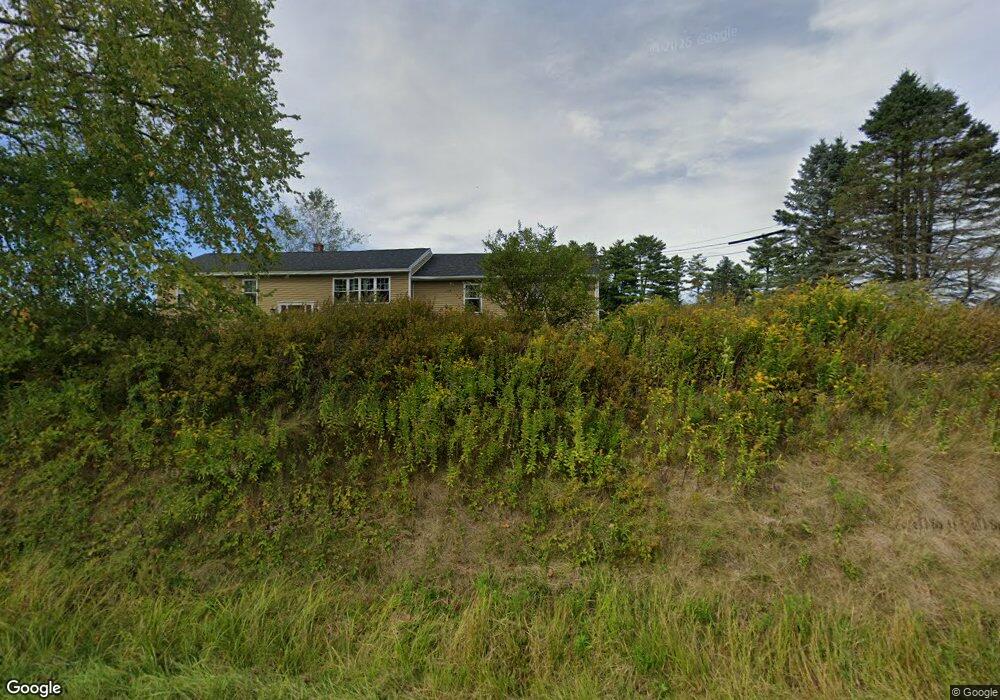
532 South St Biddeford, ME 04005
North Biddeford NeighborhoodEstimated Value: $498,000 - $610,000
4
Beds
3
Baths
1,854
Sq Ft
$305/Sq Ft
Est. Value
About This Home
This home is located at 532 South St, Biddeford, ME 04005 and is currently estimated at $565,313, approximately $304 per square foot. 532 South St is a home located in York County with nearby schools including John F Kennedy Memorial School, Biddeford Primary School, and Biddeford Intermediate School.
Ownership History
Date
Name
Owned For
Owner Type
Purchase Details
Closed on
Mar 12, 2025
Sold by
Emma David N and Emma Ashley J
Bought by
Vachon Guy L
Current Estimated Value
Purchase Details
Closed on
Sep 29, 2021
Sold by
Vachon Guy L
Bought by
Merkel Mary and Vachon Chelsea
Purchase Details
Closed on
Oct 25, 2012
Sold by
Biddeford Savings Bank
Bought by
Vachon Guy L
Home Financials for this Owner
Home Financials are based on the most recent Mortgage that was taken out on this home.
Original Mortgage
$120,209
Interest Rate
3.56%
Mortgage Type
New Conventional
Purchase Details
Closed on
Sep 27, 2011
Sold by
Lamontagne Paul E and Biddeford Sb
Bought by
Biddeford Sb
Create a Home Valuation Report for This Property
The Home Valuation Report is an in-depth analysis detailing your home's value as well as a comparison with similar homes in the area
Home Values in the Area
Average Home Value in this Area
Purchase History
| Date | Buyer | Sale Price | Title Company |
|---|---|---|---|
| Vachon Guy L | -- | None Available | |
| Vachon Guy L | -- | None Available | |
| Vachon Guy L | -- | None Available | |
| Merkel Mary | -- | None Available | |
| Merkel Mary | -- | None Available | |
| Merkel Mary | -- | None Available | |
| Vachon Guy L | -- | -- | |
| Vachon Guy L | -- | -- | |
| Biddeford Sb | -- | -- | |
| Biddeford Sb | -- | -- |
Source: Public Records
Mortgage History
| Date | Status | Borrower | Loan Amount |
|---|---|---|---|
| Previous Owner | Vachon Guy L | $120,209 |
Source: Public Records
Tax History Compared to Growth
Tax History
| Year | Tax Paid | Tax Assessment Tax Assessment Total Assessment is a certain percentage of the fair market value that is determined by local assessors to be the total taxable value of land and additions on the property. | Land | Improvement |
|---|---|---|---|---|
| 2024 | $5,893 | $414,400 | $131,600 | $282,800 |
| 2023 | $5,408 | $412,200 | $129,400 | $282,800 |
| 2022 | $4,979 | $303,400 | $72,000 | $231,400 |
| 2021 | $4,288 | $260,200 | $61,100 | $199,100 |
| 2020 | $2,937 | $235,400 | $51,500 | $183,900 |
| 2019 | $2,907 | $235,400 | $51,500 | $183,900 |
| 2018 | $4,637 | $235,400 | $51,500 | $183,900 |
| 2017 | $4,458 | $222,100 | $51,500 | $170,600 |
| 2016 | $2,834 | $222,100 | $51,500 | $170,600 |
| 2015 | $4,130 | $222,100 | $51,500 | $170,600 |
| 2014 | $4,028 | $222,100 | $51,500 | $170,600 |
| 2013 | -- | $235,600 | $59,800 | $175,800 |
Source: Public Records
Map
Nearby Homes