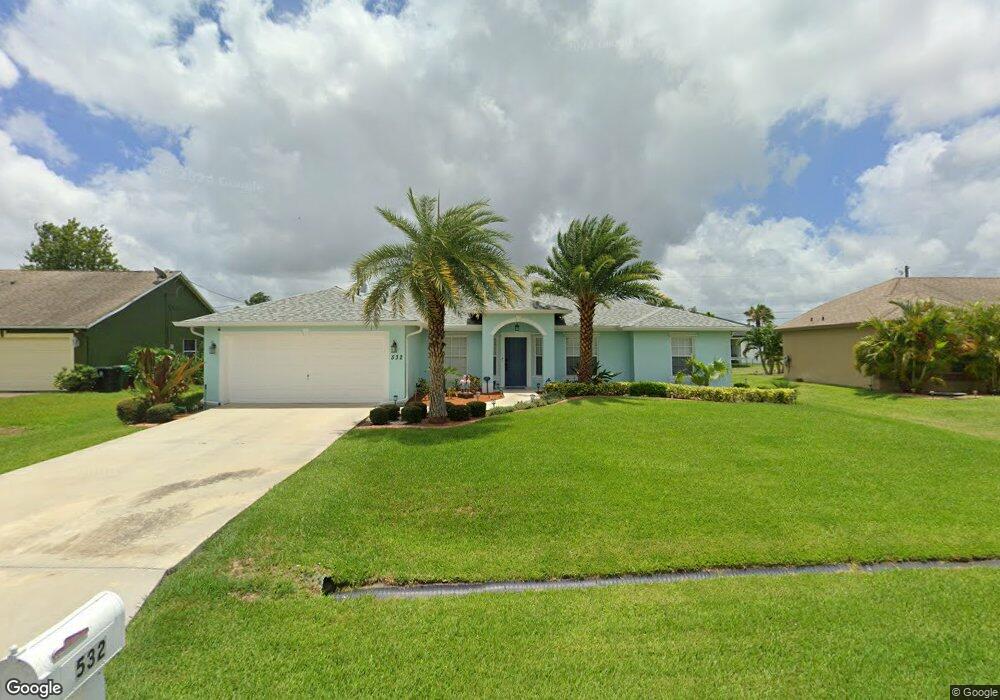
532 SW Prater Ave Port Saint Lucie, FL 34953
Tulip Park NeighborhoodEstimated Value: $472,000 - $502,000
4
Beds
3
Baths
2,142
Sq Ft
$225/Sq Ft
Est. Value
About This Home
This home is located at 532 SW Prater Ave, Port Saint Lucie, FL 34953 and is currently estimated at $481,502, approximately $224 per square foot. 532 SW Prater Ave is a home located in St. Lucie County with nearby schools including Windmill Point Elementary School, Oak Hammock K-8 School, and Bayshore Elementary School.
Ownership History
Date
Name
Owned For
Owner Type
Purchase Details
Closed on
Jun 26, 2009
Sold by
Rosa Kenneth and Rosa Marta
Bought by
Lloyd William B and Lloyd Amy L
Current Estimated Value
Home Financials for this Owner
Home Financials are based on the most recent Mortgage that was taken out on this home.
Original Mortgage
$128,038
Outstanding Balance
$80,679
Interest Rate
4.88%
Mortgage Type
FHA
Estimated Equity
$400,823
Purchase Details
Closed on
Sep 19, 2005
Sold by
Pela Louis and Pela Rossanne
Bought by
Rosa Kenneth and Rosa Marta
Purchase Details
Closed on
Apr 28, 2000
Sold by
Shutts John P and Shutts Nancy E
Bought by
Pela Louis and Pela Rossanne
Create a Home Valuation Report for This Property
The Home Valuation Report is an in-depth analysis detailing your home's value as well as a comparison with similar homes in the area
Home Values in the Area
Average Home Value in this Area
Purchase History
| Date | Buyer | Sale Price | Title Company |
|---|---|---|---|
| Lloyd William B | $130,400 | Chelsea Title Company | |
| Rosa Kenneth | $105,000 | Priority Title Inc | |
| Pela Louis | $1,600 | -- |
Source: Public Records
Mortgage History
| Date | Status | Borrower | Loan Amount |
|---|---|---|---|
| Open | Lloyd William B | $128,038 |
Source: Public Records
Tax History Compared to Growth
Tax History
| Year | Tax Paid | Tax Assessment Tax Assessment Total Assessment is a certain percentage of the fair market value that is determined by local assessors to be the total taxable value of land and additions on the property. | Land | Improvement |
|---|---|---|---|---|
| 2025 | $3,606 | $181,225 | -- | -- |
| 2024 | $3,522 | $176,118 | -- | -- |
| 2023 | $3,522 | $170,989 | $0 | $0 |
| 2022 | $3,378 | $166,009 | $0 | $0 |
| 2021 | $3,296 | $161,174 | $0 | $0 |
| 2020 | $3,313 | $158,949 | $0 | $0 |
| 2019 | $3,280 | $155,376 | $0 | $0 |
| 2018 | $2,498 | $127,357 | $0 | $0 |
| 2017 | $2,466 | $200,300 | $28,900 | $171,400 |
| 2016 | $2,427 | $183,200 | $24,700 | $158,500 |
| 2015 | $2,449 | $142,200 | $14,800 | $127,400 |
| 2014 | $2,328 | $120,361 | $0 | $0 |
Source: Public Records
Map
Nearby Homes
- 557 SW Baoy Ave
- 586 SW Kaabe Ave
- 3874 SW Kasin St
- 3624 SW Hale St
- 517 SW Kaabe Ave
- 474 SW Kaabe Ave
- 572 SW Mccomb Ave
- 611 SW Saragossa Ave
- 413 SW Mccomb Ave
- 681 SW Saragossa Ave
- 3837 SW Daisy St
- 372 SW Feldman Ave
- 566 SW Halifax Ave
- 534 SW Halifax Ave
- 3514 SW San Benito St
- 691 SW Mccomb Ave
- 342 SW Feldman Ave
- 296 SW Panther Trace
- 729 SW Sardinia Ave
- 554 SW Halden Ave
- 522 SW Prater Ave
- 537 SW Prater Ave
- 531 SW Lawler Ave
- 521 SW Lawler Ave
- 541 SW Lawler Ave
- 552 SW Prater Ave
- 512 SW Prater Ave
- 525 SW Prater Ave
- 511 SW Lawler Ave
- 513 SW Prater Ave
- 549 SW Parter Ave
- 549 SW Prater Ave
- 562 SW Prater Ave
- 502 SW Prater Ave
- 3692 SW Kasin St
- 561 SW Lawler Ave
- 501 SW Lawler Ave
- 561 SW Prater Ave
- 526 SW Baoy Ave
- 542 SW Lawler Ave