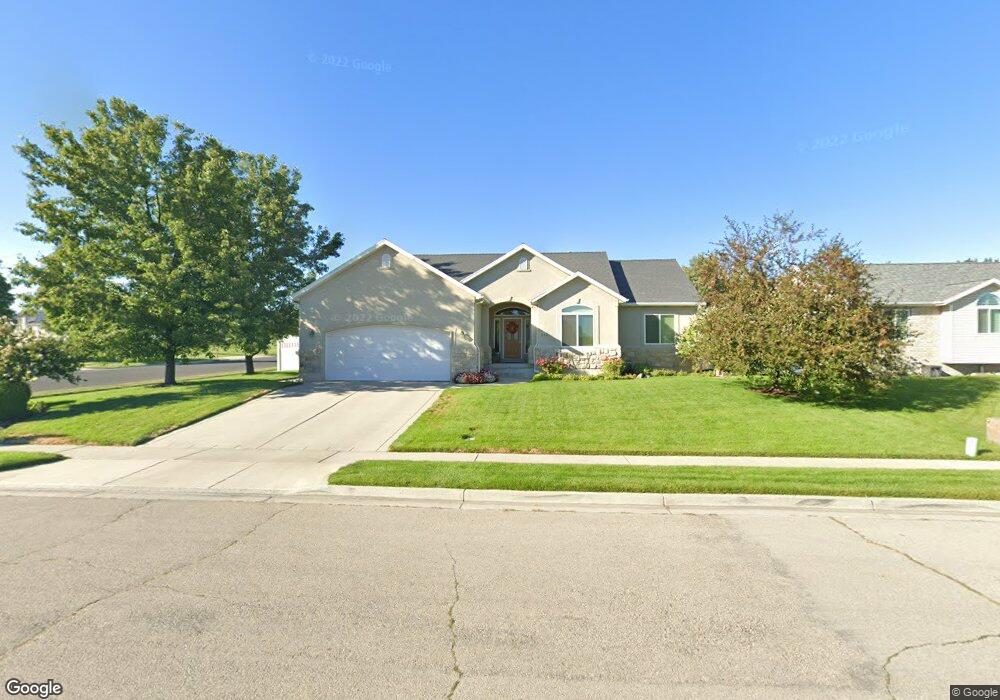
532 W 940 N American Fork, UT 84003
Estimated Value: $587,000 - $791,000
6
Beds
3
Baths
3,280
Sq Ft
$209/Sq Ft
Est. Value
About This Home
This home is located at 532 W 940 N, American Fork, UT 84003 and is currently estimated at $683,888, approximately $208 per square foot. 532 W 940 N is a home located in Utah County with nearby schools including Shelley Elementary School, American Fork Junior High School, and American Fork High School.
Ownership History
Date
Name
Owned For
Owner Type
Purchase Details
Closed on
Aug 10, 2021
Sold by
Johnson Stanley and Johnson Leslie
Bought by
Johnson Stanley Alan and Johnson Leslie Rae
Current Estimated Value
Purchase Details
Closed on
Jun 28, 2002
Sold by
Denison David H and Denison Marisa T
Bought by
Johnson Stanley and Johnson Leslie
Home Financials for this Owner
Home Financials are based on the most recent Mortgage that was taken out on this home.
Original Mortgage
$115,000
Outstanding Balance
$49,269
Interest Rate
6.86%
Estimated Equity
$634,619
Purchase Details
Closed on
Jun 27, 2000
Sold by
Denison David H
Bought by
Denison David H and Denison Marisa T
Purchase Details
Closed on
Mar 10, 2000
Sold by
Morris Shane A
Bought by
Interwest Industries Inc
Purchase Details
Closed on
Nov 18, 1998
Sold by
Patterson Construction Inc
Bought by
Morris Shane A
Create a Home Valuation Report for This Property
The Home Valuation Report is an in-depth analysis detailing your home's value as well as a comparison with similar homes in the area
Home Values in the Area
Average Home Value in this Area
Purchase History
| Date | Buyer | Sale Price | Title Company |
|---|---|---|---|
| Johnson Stanley Alan | -- | None Available | |
| Johnson Stanley | -- | Old Republic Title Company | |
| Denison David H | -- | Summit Title Co | |
| Interwest Industries Inc | -- | Summit Title Co | |
| Morris Shane A | -- | First American Title Co |
Source: Public Records
Mortgage History
| Date | Status | Borrower | Loan Amount |
|---|---|---|---|
| Open | Johnson Stanley | $115,000 |
Source: Public Records
Tax History Compared to Growth
Tax History
| Year | Tax Paid | Tax Assessment Tax Assessment Total Assessment is a certain percentage of the fair market value that is determined by local assessors to be the total taxable value of land and additions on the property. | Land | Improvement |
|---|---|---|---|---|
| 2025 | $2,835 | $348,810 | $225,800 | $408,400 |
| 2024 | $2,835 | $314,985 | $0 | $0 |
| 2023 | $2,680 | $315,755 | $0 | $0 |
| 2022 | $2,869 | $333,520 | $0 | $0 |
| 2021 | $2,464 | $447,400 | $162,000 | $285,400 |
| 2020 | $2,308 | $406,400 | $144,600 | $261,800 |
| 2019 | $2,109 | $384,200 | $133,800 | $250,400 |
| 2018 | $2,000 | $348,300 | $126,600 | $221,700 |
| 2017 | $1,901 | $178,640 | $0 | $0 |
| 2016 | $1,973 | $172,260 | $0 | $0 |
| 2015 | $1,955 | $162,030 | $0 | $0 |
| 2014 | $1,867 | $152,625 | $0 | $0 |
Source: Public Records
Map
Nearby Homes
- 987 N 410 W
- 471 W 1040 N
- 602 W 860 N
- 914 N 400 W Unit A
- 3889 W 950 Cir N Unit 366
- 425 W 1120 N
- 344 W 1080 N
- 984 N 300 W
- 822 W 800 St N Unit LOT319
- 3935 W 1000 N Unit 438
- 3983 W 1000 N Unit 442
- 4007 W 1000 N
- 3947 W 1000 N Unit 439
- 3959 W 1000 N
- 822 N 860 W Unit 317
- 641 N 420 W
- 962 N 780 St W Unit 508
- 974 N 780 St W Unit 509
- 916 N 780 St W Unit 501
- 796 N 200 W