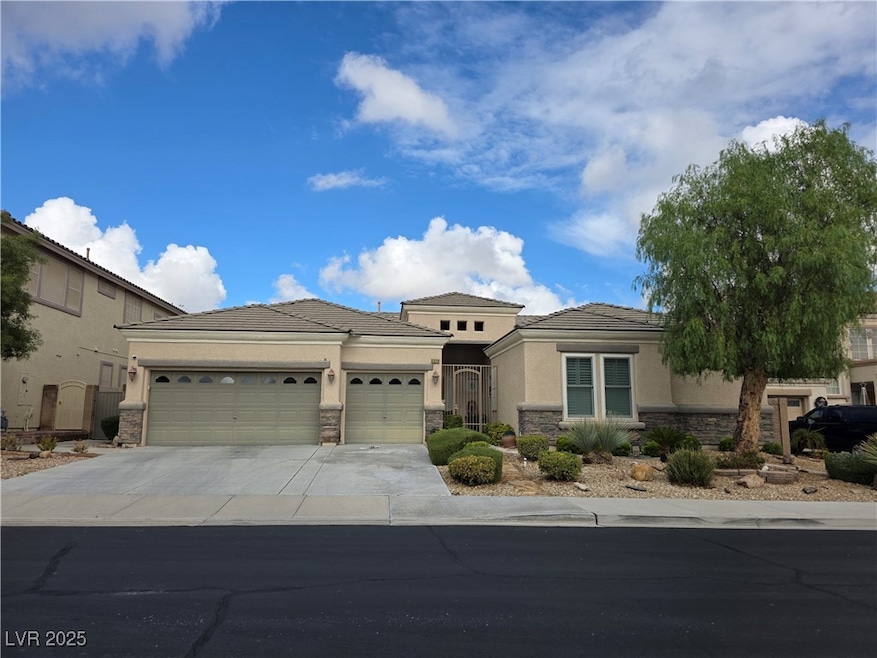
5320 Polizze Ave Unit 8 Las Vegas, NV 89141
Southern Highlands NeighborhoodEstimated payment $4,590/month
Highlights
- Solar Heated Pool and Spa
- Gated Community
- Covered Patio or Porch
- Charles & Phyllis Frias Elementary School Rated 9+
- Vaulted Ceiling
- 3 Car Attached Garage
About This Home
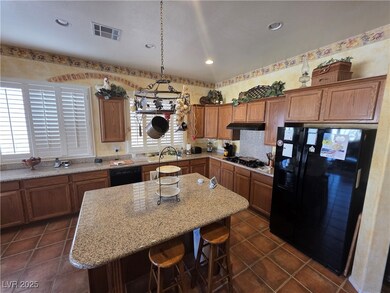
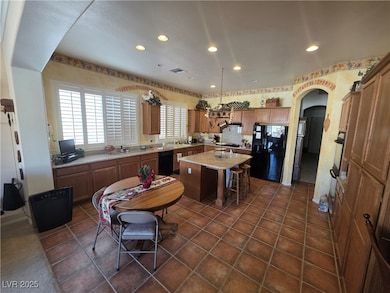
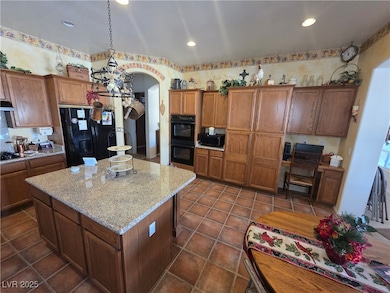
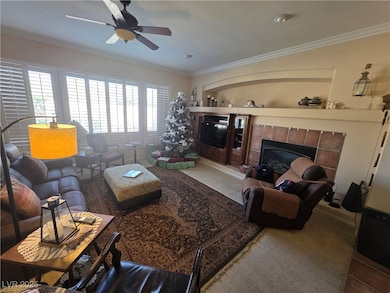
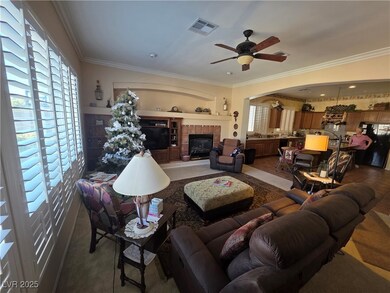
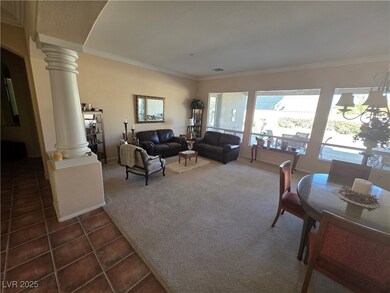
Fantastic large 1-story in the heart of Southern Highlands in a nice gated community !! A lovely home offering 4 bedrooms, 1 den with built ins, shutters throughout, 3 car garage, pool and spa ! Enter through a gated entry way to experience a large living area overlooking the pool/spa area ! Kitchen offers granite counters, custom cabinets and opens into a large family room overlooking the pool area. Home offers high ceilings, ceiling fans throughout, 2 primary bedrooms on either end of the home, family room with beautiful fireplace, too much to list. Come see and fall in love....
Listing Agent
Realty ONE Group, Inc Brokerage Phone: (702) 326-2333 License #S.0053080 Listed on: 11/19/2025

Home Details
Home Type
- Single Family
Est. Annual Taxes
- $4,598
Year Built
- Built in 2002
Lot Details
- 8,712 Sq Ft Lot
- South Facing Home
- Dog Run
- Back Yard Fenced
- Block Wall Fence
- Desert Landscape
HOA Fees
Parking
- 3 Car Attached Garage
- Parking Storage or Cabinetry
- Inside Entrance
- Garage Door Opener
- Open Parking
Home Design
- Frame Construction
- Tile Roof
- Stucco
Interior Spaces
- 3,178 Sq Ft Home
- 1-Story Property
- Vaulted Ceiling
- Ceiling Fan
- Gas Fireplace
- Double Pane Windows
- Blinds
- Family Room with Fireplace
Kitchen
- Gas Range
- Microwave
- Dishwasher
- Disposal
Flooring
- Carpet
- Ceramic Tile
Bedrooms and Bathrooms
- 4 Bedrooms
Laundry
- Laundry Room
- Laundry on main level
- Dryer
- Washer
- Sink Near Laundry
- Laundry Cabinets
Eco-Friendly Details
- Energy-Efficient Windows
Pool
- Solar Heated Pool and Spa
- Solar Heated In Ground Pool
- In Ground Spa
Outdoor Features
- Covered Patio or Porch
- Shed
Schools
- Bass Elementary School
- Sawyer Grant Middle School
- Sierra Vista High School
Utilities
- Two cooling system units
- Central Heating and Cooling System
- Multiple Heating Units
- Heating System Uses Gas
- Cable TV Available
Community Details
Overview
- Association fees include management
- Southern Highlands Association, Phone Number (702) 361-6640
- Southern Highlands #1 Subdivision
- The community has rules related to covenants, conditions, and restrictions
Security
- Controlled Access
- Gated Community
Map
Home Values in the Area
Average Home Value in this Area
Tax History
| Year | Tax Paid | Tax Assessment Tax Assessment Total Assessment is a certain percentage of the fair market value that is determined by local assessors to be the total taxable value of land and additions on the property. | Land | Improvement |
|---|---|---|---|---|
| 2025 | $4,087 | $215,681 | $72,800 | $142,881 |
| 2024 | $3,968 | $215,681 | $72,800 | $142,881 |
| 2023 | $3,968 | $194,912 | $60,200 | $134,712 |
| 2022 | $3,853 | $178,453 | $54,950 | $123,503 |
| 2021 | $3,741 | $161,179 | $43,750 | $117,429 |
| 2020 | $3,629 | $163,403 | $47,250 | $116,153 |
| 2019 | $3,523 | $152,216 | $38,150 | $114,066 |
| 2018 | $3,421 | $144,693 | $34,650 | $110,043 |
| 2017 | $4,229 | $144,172 | $32,550 | $111,622 |
| 2016 | $3,239 | $140,626 | $28,000 | $112,626 |
| 2015 | $3,233 | $116,308 | $20,300 | $96,008 |
| 2014 | $3,138 | $103,798 | $18,375 | $85,423 |
Property History
| Date | Event | Price | List to Sale | Price per Sq Ft |
|---|---|---|---|---|
| 12/01/2025 12/01/25 | For Sale | $775,000 | -- | $244 / Sq Ft |
Purchase History
| Date | Type | Sale Price | Title Company |
|---|---|---|---|
| Interfamily Deed Transfer | -- | -- | |
| Bargain Sale Deed | $330,000 | Fidelity National Title | |
| Interfamily Deed Transfer | -- | United Title | |
| Bargain Sale Deed | $298,795 | United Title | |
| Bargain Sale Deed | -- | United Title |
Mortgage History
| Date | Status | Loan Amount | Loan Type |
|---|---|---|---|
| Open | $264,000 | No Value Available | |
| Previous Owner | $298,795 | No Value Available |
Source: Las Vegas REALTORS®
MLS Number: 2736376
APN: 176-36-615-024
Disclaimer: Certain information contained herein is derived from information provided by parties other than Homes.com. All information provided is deemed reliable, but is not guaranteed to be accurate and should be independently verified.
![]() The data relating to real estate for sale on this web site comes in part from the INTERNET DATA EXCHANGE Program of the Greater Las Vegas Association of REALTORS® MLS. Real estate listings held by brokerage firms other than this site owner are marked with the IDX logo. Information is deemed reliable but not guaranteed. Copyright 2025 of the Greater Las Vegas Association of REALTORS® MLS. All rights reserved.
The data relating to real estate for sale on this web site comes in part from the INTERNET DATA EXCHANGE Program of the Greater Las Vegas Association of REALTORS® MLS. Real estate listings held by brokerage firms other than this site owner are marked with the IDX logo. Information is deemed reliable but not guaranteed. Copyright 2025 of the Greater Las Vegas Association of REALTORS® MLS. All rights reserved.
- 5220 Melbourne Ridge Ct
- 5214 Melbourne Ridge Ct
- 10942 Civiletti St
- 5070 Masotta Ave
- 10798 Tapestry Winds St
- 5053 Benezette Ct
- 4997 Graziano Ave
- 11024 Vallerosa St
- 10682 Eiffel Ct
- 10668 Porta Romana Ct
- 5405 San Bellasera Ct
- 4915 Monteleone Ave Unit 3
- 11022 Saint Rafael St
- 5147 Villa Vecchio Ct
- 5100 Ivy Creek Ct
- 10620 Fable St
- 5148 Villa Vecchio Ct
- 4923 Bella Strada Ct
- 5785 Farmhouse Ct Unit 2
- 11152 Montagne Marron Blvd
- 10837 Osceola Mills St
- 10820 Canisteo St
- 5178 Meraki Ave
- 10738 Tapestry Winds St
- 11012 Socrates Ridge St
- 5028 Nardini Ave
- 4995 Nardini Ave
- 10668 Porta Romana Ct
- 11124 Socrates Ridge St
- 11078 Cusumano Ct Unit 4
- 11127 Castellane Dr
- 5148 Villa Vecchio Ct
- 5781 Magini Ave
- 11148 Star Lily St
- 5233 Sand Dollar Ave
- 11076 Zampino St
- 10925 Southern Highlands Pkwy
- 11113 Prado Del Rey Ln
- 5994 Attavilla Dr
- 5536 Danforth Ave