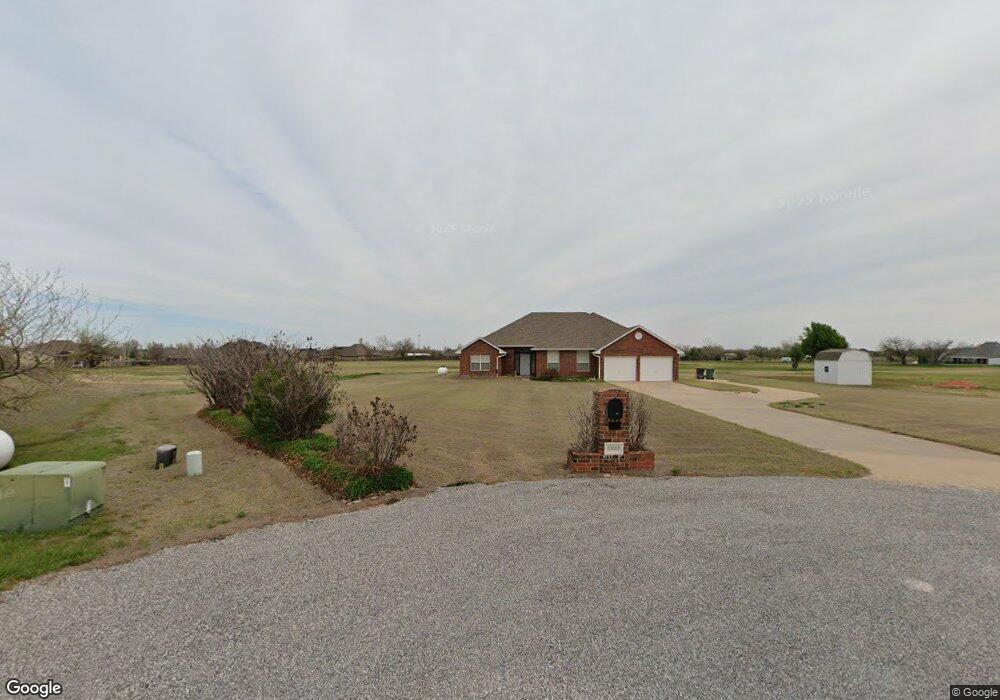
5320 Steeple Run Cir Mustang, OK 73064
Estimated Value: $435,235 - $454,000
3
Beds
3
Baths
2,248
Sq Ft
$197/Sq Ft
Est. Value
About This Home
This home is located at 5320 Steeple Run Cir, Mustang, OK 73064 and is currently estimated at $442,412, approximately $196 per square foot. 5320 Steeple Run Cir is a home located in Canadian County with nearby schools including Mustang Lakehoma Elementary School, Mustang Horizon Intermediate School, and Mustang Middle School.
Ownership History
Date
Name
Owned For
Owner Type
Purchase Details
Closed on
Sep 20, 2021
Sold by
Hickman Linda Rae and Hickman Linda
Bought by
Hickman Larry Ray
Current Estimated Value
Home Financials for this Owner
Home Financials are based on the most recent Mortgage that was taken out on this home.
Original Mortgage
$258,000
Outstanding Balance
$234,761
Interest Rate
2.8%
Mortgage Type
New Conventional
Estimated Equity
$207,651
Purchase Details
Closed on
Aug 15, 2003
Sold by
Mcbride,J W Inc
Bought by
Hickman Larry Ray and Linda Rae
Purchase Details
Closed on
Feb 19, 2003
Sold by
Hickman Larry Ray and Hickman Linda~Rae
Home Financials for this Owner
Home Financials are based on the most recent Mortgage that was taken out on this home.
Original Mortgage
$135,000
Interest Rate
5.83%
Purchase Details
Closed on
Oct 7, 1994
Sold by
Anderson David M and Anderson Deborah
Create a Home Valuation Report for This Property
The Home Valuation Report is an in-depth analysis detailing your home's value as well as a comparison with similar homes in the area
Home Values in the Area
Average Home Value in this Area
Purchase History
| Date | Buyer | Sale Price | Title Company |
|---|---|---|---|
| Hickman Larry Ray | -- | Old Republic Title | |
| Hickman Larry Ray | $190,000 | -- | |
| -- | $26,500 | -- | |
| -- | $26,500 | -- |
Source: Public Records
Mortgage History
| Date | Status | Borrower | Loan Amount |
|---|---|---|---|
| Open | Hickman Larry Ray | $258,000 | |
| Previous Owner | -- | $135,000 |
Source: Public Records
Tax History Compared to Growth
Tax History
| Year | Tax Paid | Tax Assessment Tax Assessment Total Assessment is a certain percentage of the fair market value that is determined by local assessors to be the total taxable value of land and additions on the property. | Land | Improvement |
|---|---|---|---|---|
| 2024 | $3,871 | $36,245 | $10,834 | $25,411 |
| 2023 | $3,871 | $35,189 | $10,326 | $24,863 |
| 2022 | $3,812 | $34,164 | $9,875 | $24,289 |
| 2021 | $3,684 | $33,169 | $8,902 | $24,267 |
| 2020 | $3,610 | $32,204 | $8,147 | $24,057 |
| 2019 | $3,498 | $31,265 | $7,533 | $23,732 |
| 2018 | $3,455 | $30,354 | $7,411 | $22,943 |
| 2017 | $3,308 | $29,471 | $7,094 | $22,377 |
| 2016 | $3,200 | $29,471 | $7,210 | $22,261 |
| 2015 | $3,033 | $27,779 | $6,441 | $21,338 |
| 2014 | $3,033 | $26,971 | $5,666 | $21,305 |
Source: Public Records
Map
Nearby Homes
- 4901 Horizon Blvd
- 5409 Heidelberg Dr
- 0 Regan Rd
- 0 SW 59th St
- 13132 SW 44th St
- 1305 N Hunters Bridge Way
- 1012 N Scouts Court Way
- 5108 Mccann Ct
- 0 SW 44th St
- 1721 W Antler Way
- 1400 Quail Lake Way
- 2029 W Oak Valley Way
- 821 N Clear Springs Way
- 1425 W Harvard Way
- 3900 S Cemetery Rd
- 708 N Buckhorn Way
- 708 N White Tail Way
- 913 N Centennial Way
- 1401 W Harvard Way
- 1935 W Flintlock Way
- 5312 Steeple Run Cir
- 5400 W Steeplechase Run
- 5400 Steeple Run Dr
- 12121 SW 51st St
- 12101 SW 51st St
- 12105 SW 51st St
- 12109 SW 51st St
- 12132 SW 51st St
- 12129 SW 51st St
- 12124 SW 51st St
- 12120 SW 51st St
- 12108 SW 51st St
- 12116 SW 51st St
- 12128 SW 51st St
- 12104 SW 51st St
- 12100 SW 51st St
- 5236 Horizon Blvd
- 5225 Horizon Blvd
- 5224 Horizon Blvd
- 5213 Horizon Blvd