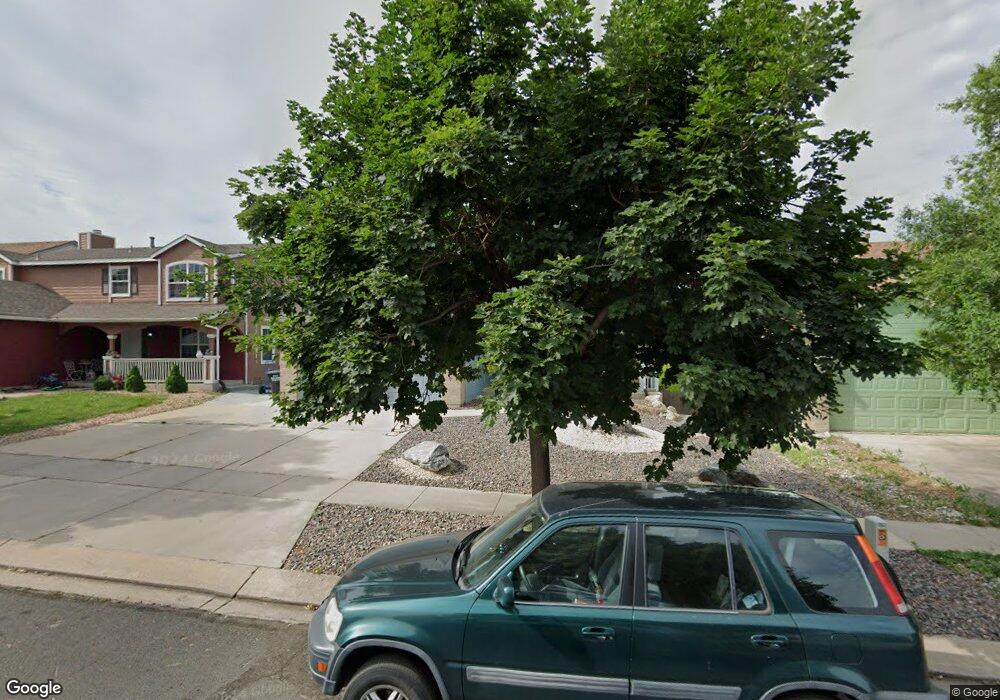
5320 Whip Trail Colorado Springs, CO 80917
Village Seven NeighborhoodEstimated Value: $393,000 - $502,000
4
Beds
4
Baths
1,995
Sq Ft
$231/Sq Ft
Est. Value
About This Home
This home is located at 5320 Whip Trail, Colorado Springs, CO 80917 and is currently estimated at $461,108, approximately $231 per square foot. 5320 Whip Trail is a home located in El Paso County with nearby schools including Rudy Elementary School, Sabin Middle School, and Doherty High School.
Ownership History
Date
Name
Owned For
Owner Type
Purchase Details
Closed on
Oct 20, 2016
Sold by
Kim Young Min
Bought by
Kim Joon Yon and Kim Young Min
Current Estimated Value
Purchase Details
Closed on
Jun 20, 2016
Sold by
Kim Joon Y
Bought by
Kim Young Min
Purchase Details
Closed on
Mar 22, 2011
Sold by
Kim Joon Y and Kim So Hyun
Bought by
Kim Joon Y
Purchase Details
Closed on
Feb 4, 2011
Sold by
Nam Sun Woo and Lee Hyon K
Bought by
Kim Joon Y and Kim So Hyun
Purchase Details
Closed on
Aug 27, 2004
Sold by
Lee Hyon K
Bought by
Lee Hyon K and Nam Sun Woo
Purchase Details
Closed on
Sep 15, 1995
Sold by
Oxbow Company Ltd
Bought by
Lee Hyon K
Home Financials for this Owner
Home Financials are based on the most recent Mortgage that was taken out on this home.
Original Mortgage
$160,350
Interest Rate
7.77%
Mortgage Type
VA
Create a Home Valuation Report for This Property
The Home Valuation Report is an in-depth analysis detailing your home's value as well as a comparison with similar homes in the area
Home Values in the Area
Average Home Value in this Area
Purchase History
| Date | Buyer | Sale Price | Title Company |
|---|---|---|---|
| Kim Joon Yon | -- | None Available | |
| Kim Young Min | -- | None Available | |
| Kim Joon Y | -- | None Available | |
| Kim Joon Y | -- | None Available | |
| Lee Hyon K | -- | -- | |
| Lee Hyon K | $171,495 | Unified Title Co Inc |
Source: Public Records
Mortgage History
| Date | Status | Borrower | Loan Amount |
|---|---|---|---|
| Previous Owner | Lee Hyon K | $160,350 |
Source: Public Records
Tax History Compared to Growth
Tax History
| Year | Tax Paid | Tax Assessment Tax Assessment Total Assessment is a certain percentage of the fair market value that is determined by local assessors to be the total taxable value of land and additions on the property. | Land | Improvement |
|---|---|---|---|---|
| 2025 | $1,626 | $33,540 | -- | -- |
| 2024 | $1,510 | $33,680 | $5,490 | $28,190 |
| 2023 | $1,510 | $33,680 | $5,490 | $28,190 |
| 2022 | $1,433 | $25,610 | $4,170 | $21,440 |
| 2021 | $1,555 | $26,350 | $4,290 | $22,060 |
| 2020 | $1,505 | $22,180 | $3,720 | $18,460 |
| 2019 | $1,497 | $22,180 | $3,720 | $18,460 |
| 2018 | $1,390 | $18,950 | $3,240 | $15,710 |
| 2017 | $1,317 | $18,950 | $3,240 | $15,710 |
| 2016 | $1,026 | $17,700 | $2,710 | $14,990 |
| 2015 | $1,022 | $17,700 | $2,710 | $14,990 |
| 2014 | $1,005 | $16,700 | $2,710 | $13,990 |
Source: Public Records
Map
Nearby Homes
- 4835 Castledown Rd
- 5024 Secota Ln Unit 2
- 5083 Masheena Ln Unit 4
- 3660 Inspiration Dr
- 5050 Sunsuite Trail
- 4889 Evening Sun Ln
- 4867 Evening Sun Ln
- 5130 Whimsical Dr
- 3726 Oro Blanco Dr
- 3855 Inspiration Dr
- 3938 Iron Horse Trail
- 4751 Daybreak Cir Unit D25
- 4713 Daybreak Cir Unit A5
- 3325 Raindrop Dr
- 3371 Teardrop Cir
- 5458 N Buckskin Pass Dr
- 5255 Pony Soldier Dr
- 4505 N Carefree Cir Unit L4505
- 4735 S Crimson Cir
- 4815 Cheerful Rd
- 5330 Whip Trail
- 5310 Whip Trail
- 5340 Whip Trail
- 5270 Whip Trail
- 5350 Whip Trail
- 5260 Whip Trail
- 5315 Whip Trail
- 5305 Whip Trail
- 5360 Whip Trail
- 5250 Whip Trail
- 5325 Whip Trail
- 5285 Whip Trail
- 5335 Whip Trail
- 5055 N Carefree Cir
- 5275 Whip Trail
- 5075 N Carefree Cir
- 5045 N Carefree Cir
- 5370 Whip Trail
- 5345 Whip Trail
- 5265 Whip Trail