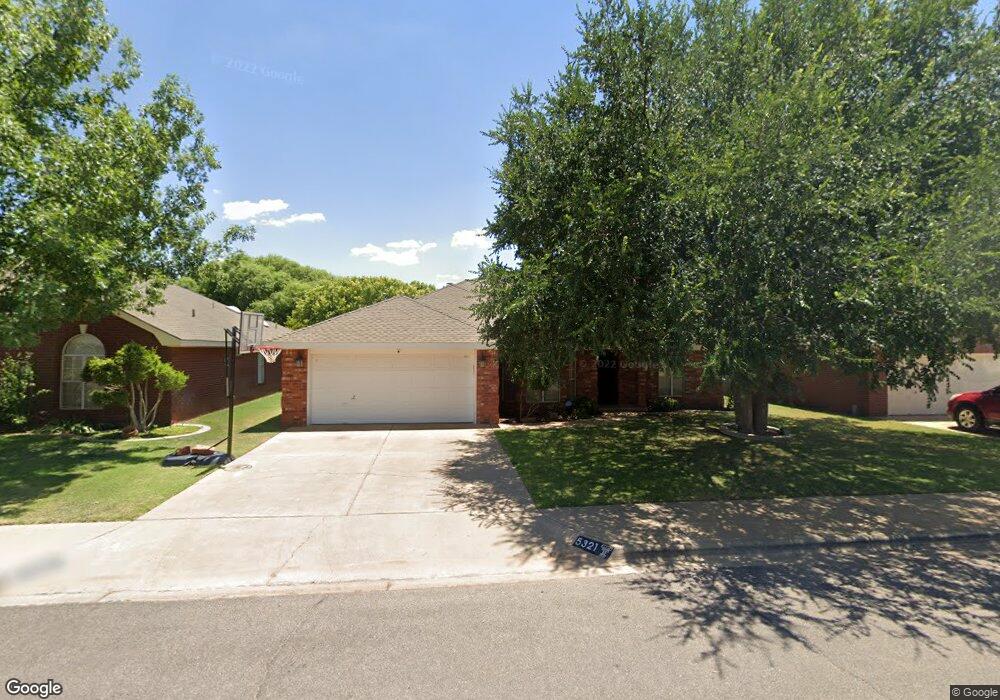
5321 68th St Lubbock, TX 79424
Remington Park NeighborhoodEstimated Value: $278,510 - $289,000
4
Beds
2
Baths
2,232
Sq Ft
$128/Sq Ft
Est. Value
About This Home
This home is located at 5321 68th St, Lubbock, TX 79424 and is currently estimated at $285,128, approximately $127 per square foot. 5321 68th St is a home located in Lubbock County with nearby schools including Whiteside Elementary School, Irons Middle School, and Coronado High School.
Ownership History
Date
Name
Owned For
Owner Type
Purchase Details
Closed on
Apr 13, 2018
Sold by
Herbert Michael H and Herbert Christi L
Bought by
Philpot Jessica and Davis Margaret
Current Estimated Value
Home Financials for this Owner
Home Financials are based on the most recent Mortgage that was taken out on this home.
Original Mortgage
$208,160
Outstanding Balance
$179,756
Interest Rate
4.62%
Mortgage Type
FHA
Estimated Equity
$105,372
Purchase Details
Closed on
Aug 3, 2012
Sold by
Perry Dean R and Perry Tracy A
Bought by
Herbert Michael H and Herbert Christi L
Home Financials for this Owner
Home Financials are based on the most recent Mortgage that was taken out on this home.
Original Mortgage
$168,884
Interest Rate
3.25%
Mortgage Type
FHA
Purchase Details
Closed on
Feb 6, 2003
Sold by
Gould Russell T
Bought by
Herbert Michael H and Herbert Christi L
Purchase Details
Closed on
Nov 18, 1997
Sold by
Bassinger Ron Inc Realtors
Bought by
Herbert Michael H and Herbert Christi L
Create a Home Valuation Report for This Property
The Home Valuation Report is an in-depth analysis detailing your home's value as well as a comparison with similar homes in the area
Home Values in the Area
Average Home Value in this Area
Purchase History
| Date | Buyer | Sale Price | Title Company |
|---|---|---|---|
| Philpot Jessica | -- | True Title | |
| Herbert Michael H | -- | Western Title Company | |
| Herbert Michael H | -- | -- | |
| Herbert Michael H | -- | -- |
Source: Public Records
Mortgage History
| Date | Status | Borrower | Loan Amount |
|---|---|---|---|
| Open | Philpot Jessica | $208,160 | |
| Previous Owner | Herbert Michael H | $168,884 |
Source: Public Records
Tax History
| Year | Tax Paid | Tax Assessment Tax Assessment Total Assessment is a certain percentage of the fair market value that is determined by local assessors to be the total taxable value of land and additions on the property. | Land | Improvement |
|---|---|---|---|---|
| 2025 | $4,661 | $264,898 | $17,325 | $247,573 |
| 2024 | $51 | $281,675 | $17,325 | $264,350 |
| 2023 | $5,062 | $272,338 | $17,325 | $255,013 |
| 2022 | $5,012 | $247,580 | $17,325 | $230,255 |
| 2021 | $4,975 | $232,280 | $17,325 | $214,955 |
| 2020 | $4,645 | $213,604 | $17,325 | $196,279 |
| 2019 | $4,538 | $202,142 | $17,325 | $184,817 |
| 2018 | $4,703 | $209,200 | $17,325 | $191,875 |
| 2017 | $4,404 | $195,674 | $17,325 | $178,349 |
| 2016 | $4,236 | $188,203 | $17,325 | $170,878 |
| 2015 | $3,723 | $186,692 | $17,325 | $169,367 |
| 2014 | $3,723 | $175,746 | $17,325 | $158,421 |
Source: Public Records
Map
Nearby Homes
Your Personal Tour Guide
Ask me questions while you tour the home.