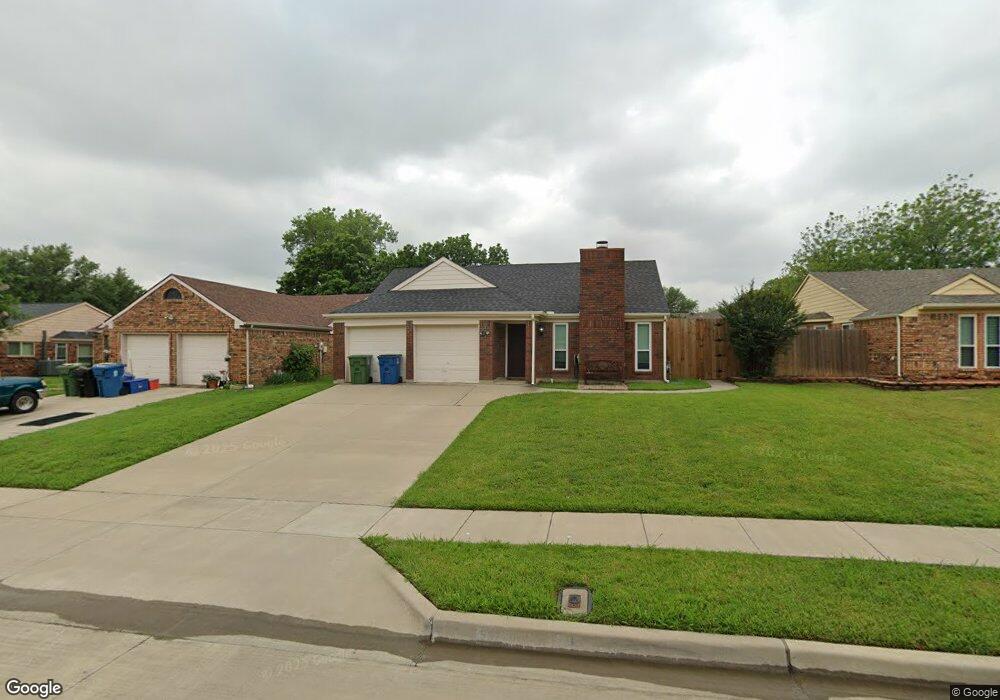
5321 Colonial Dr Flower Mound, TX 75028
Prairie Creek NeighborhoodEstimated Value: $366,000 - $387,000
--
Bed
2
Baths
1,442
Sq Ft
$261/Sq Ft
Est. Value
About This Home
This home is located at 5321 Colonial Dr, Flower Mound, TX 75028 and is currently estimated at $375,831, approximately $260 per square foot. 5321 Colonial Dr is a home located in Denton County with nearby schools including Prairie Trail Elementary School, Lamar Middle School, and Marcus High School.
Ownership History
Date
Name
Owned For
Owner Type
Purchase Details
Closed on
Jun 27, 2023
Sold by
Bywater Tandee Leigh
Bought by
Bywater Tandee Leigh
Current Estimated Value
Purchase Details
Closed on
Aug 24, 2000
Sold by
Hud
Bought by
Bywater Richard C and Bywater Tandee
Home Financials for this Owner
Home Financials are based on the most recent Mortgage that was taken out on this home.
Original Mortgage
$104,560
Interest Rate
8.16%
Mortgage Type
FHA
Purchase Details
Closed on
May 11, 2000
Sold by
James B Nutter & Company
Bought by
Hud
Purchase Details
Closed on
May 2, 2000
Sold by
Zaidi Tassnim and Zaidi Tasneem
Bought by
James B Nutter & Company
Purchase Details
Closed on
Apr 19, 1994
Sold by
Zaidi Tasneem and Zaidi Tasneem Qureshi
Bought by
Zaidi Tasneem
Home Financials for this Owner
Home Financials are based on the most recent Mortgage that was taken out on this home.
Original Mortgage
$84,441
Interest Rate
7.71%
Mortgage Type
FHA
Create a Home Valuation Report for This Property
The Home Valuation Report is an in-depth analysis detailing your home's value as well as a comparison with similar homes in the area
Home Values in the Area
Average Home Value in this Area
Purchase History
| Date | Buyer | Sale Price | Title Company |
|---|---|---|---|
| Bywater Tandee Leigh | -- | None Listed On Document | |
| Bywater Richard C | -- | -- | |
| Hud | -- | -- | |
| Hud | -- | -- | |
| James B Nutter & Company | $86,200 | -- | |
| Zaidi Tasneem | -- | -- |
Source: Public Records
Mortgage History
| Date | Status | Borrower | Loan Amount |
|---|---|---|---|
| Previous Owner | Bywater Richard C | $104,560 | |
| Previous Owner | Zaidi Tasneem | $84,441 |
Source: Public Records
Tax History Compared to Growth
Tax History
| Year | Tax Paid | Tax Assessment Tax Assessment Total Assessment is a certain percentage of the fair market value that is determined by local assessors to be the total taxable value of land and additions on the property. | Land | Improvement |
|---|---|---|---|---|
| 2025 | $4,472 | $356,800 | $85,988 | $270,812 |
| 2024 | $5,770 | $340,811 | $0 | $0 |
| 2023 | $3,978 | $309,828 | $85,988 | $267,846 |
| 2022 | $5,237 | $281,662 | $72,169 | $229,249 |
| 2021 | $5,144 | $256,056 | $49,136 | $206,920 |
| 2020 | $4,959 | $248,039 | $49,136 | $198,903 |
| 2019 | $5,089 | $245,578 | $49,136 | $196,442 |
| 2018 | $4,757 | $228,215 | $49,136 | $179,765 |
| 2017 | $4,372 | $207,468 | $49,136 | $158,332 |
| 2016 | $4,140 | $196,468 | $49,136 | $152,488 |
| 2015 | $3,420 | $178,607 | $32,275 | $146,332 |
| 2014 | $3,420 | $166,435 | $32,275 | $134,160 |
| 2013 | -- | $153,809 | $32,275 | $121,534 |
Source: Public Records
Map
Nearby Homes
- 5329 Ponder Place
- 5400 Carriage Ct
- 5309 Buckner Dr
- 1208 Homestead St
- 5324 Peterson Ct
- 1105 Coker Dr
- 1617 Oak Creek Dr
- 4925 Marcus Dr
- 1682 Shannon Dr
- 1661 Crosshaven Dr
- 5508 Frost Ln
- 1204 Marcus Ct
- 1554 N Valley Pkwy
- 1602 Autumn Breeze Ln
- 1613 Autumn Breeze Ln
- 1601 Autumn Breeze Ln
- 1685 Niagara Blvd
- 1581 Glenmore Dr
- 1837 Meyerwood Ln N
- 1534 Autumn Breeze Ln
- 5325 Colonial Dr
- 5317 Colonial Dr
- 5313 Colonial Dr
- 5329 Colonial Dr
- 5300 Timber Creek Rd
- 5304 Timber Creek Rd
- 5320 Colonial Dr
- 5324 Colonial Dr
- 5308 Timber Creek Rd
- 5224 Timber Creek Rd
- 5309 Colonial Dr
- 5316 Colonial Dr
- 5333 Colonial Dr
- 5328 Colonial Dr
- 5312 Colonial Dr
- 5332 Colonial Dr
- 5305 Colonial Dr
- 5220 Timber Creek Rd
- 5312 Timber Creek Rd
- 5337 Colonial Dr