Estimated Value: $387,000 - $420,000
2
Beds
2
Baths
1,146
Sq Ft
$352/Sq Ft
Est. Value
About This Home
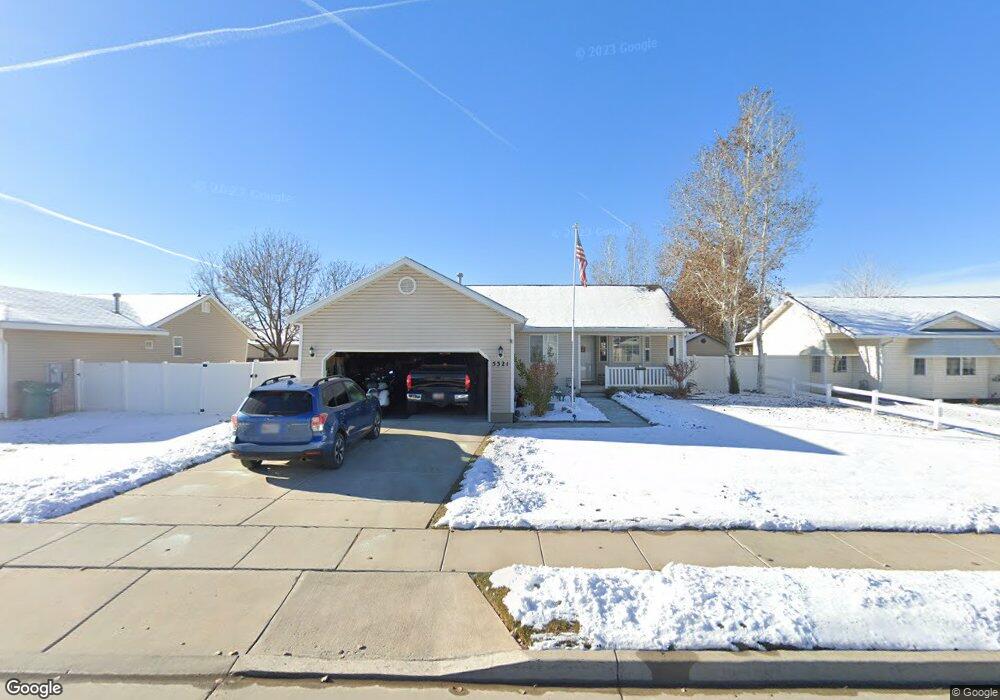
This home is located at 5321 S 4100 W, Roy, UT 84067 and is currently estimated at $403,560, approximately $352 per square foot. 5321 S 4100 W is a home located in Weber County with nearby schools including Country View School, Rocky Mountain Junior High School, and Bridge Elementary School.
Ownership History
Date
Name
Owned For
Owner Type
Purchase Details
Closed on
Jul 1, 2020
Sold by
Creamer Ron L
Bought by
Creamer Ron Lamont and Ron Lamont Reamer Rlt
Current Estimated Value
Purchase Details
Closed on
Aug 10, 2007
Sold by
Dugger Darren A and Dugger Amber D
Bought by
Creamer Ron L
Purchase Details
Closed on
May 23, 2005
Sold by
Dugger Amber D and Dugger Darren A
Bought by
Dugger Darren A and Dugger Amber D
Home Financials for this Owner
Home Financials are based on the most recent Mortgage that was taken out on this home.
Original Mortgage
$111,000
Interest Rate
5.25%
Mortgage Type
Fannie Mae Freddie Mac
Purchase Details
Closed on
Oct 26, 2001
Sold by
Alpine Homes Inc
Bought by
Dugger Amber D and Dugger Darren A
Home Financials for this Owner
Home Financials are based on the most recent Mortgage that was taken out on this home.
Original Mortgage
$111,553
Interest Rate
6.87%
Mortgage Type
FHA
Create a Home Valuation Report for This Property
The Home Valuation Report is an in-depth analysis detailing your home's value as well as a comparison with similar homes in the area
Home Values in the Area
Average Home Value in this Area
Purchase History
| Date | Buyer | Sale Price | Title Company |
|---|---|---|---|
| Creamer Ron Lamont | -- | None Available | |
| Creamer Ron L | -- | First American Riverdale | |
| Dugger Darren A | -- | Security Title | |
| Dugger Amber D | -- | First American Title Insuran |
Source: Public Records
Mortgage History
| Date | Status | Borrower | Loan Amount |
|---|---|---|---|
| Previous Owner | Dugger Darren A | $111,000 | |
| Previous Owner | Dugger Amber D | $111,553 |
Source: Public Records
Tax History
| Year | Tax Paid | Tax Assessment Tax Assessment Total Assessment is a certain percentage of the fair market value that is determined by local assessors to be the total taxable value of land and additions on the property. | Land | Improvement |
|---|---|---|---|---|
| 2025 | $2,395 | $375,646 | $125,007 | $250,639 |
| 2024 | $2,319 | $201,299 | $68,753 | $132,546 |
| 2023 | $2,425 | $212,850 | $65,864 | $146,986 |
| 2022 | $2,468 | $223,300 | $57,758 | $165,542 |
| 2021 | $1,937 | $286,000 | $79,963 | $206,037 |
| 2020 | $1,875 | $255,000 | $79,963 | $175,037 |
| 2019 | $1,771 | $226,000 | $44,976 | $181,024 |
| 2018 | $1,692 | $203,000 | $42,041 | $160,959 |
| 2017 | $1,564 | $175,000 | $42,041 | $132,959 |
| 2016 | $1,520 | $91,486 | $21,944 | $69,542 |
| 2015 | $1,345 | $82,091 | $21,944 | $60,147 |
| 2014 | $1,217 | $72,329 | $19,237 | $53,092 |
Source: Public Records
Map
Nearby Homes
Your Personal Tour Guide
Ask me questions while you tour the home.