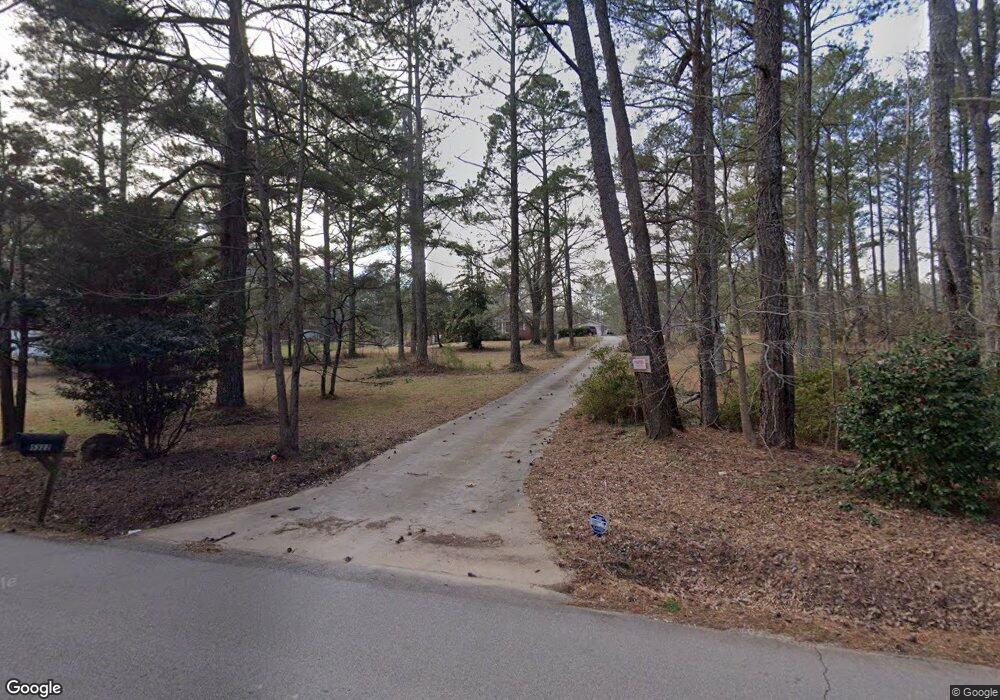
5322 Lombard Rd Ellenwood, GA 30294
Estimated Value: $302,000 - $352,962
3
Beds
3
Baths
1,634
Sq Ft
$200/Sq Ft
Est. Value
About This Home
This home is located at 5322 Lombard Rd, Ellenwood, GA 30294 and is currently estimated at $326,741, approximately $199 per square foot. 5322 Lombard Rd is a home located in Henry County with nearby schools including Austin Road Elementary School, Austin Road Middle School, and Woodland High School.
Ownership History
Date
Name
Owned For
Owner Type
Purchase Details
Closed on
Mar 23, 2015
Sold by
Henderson Carolyn K
Bought by
Henderson Ernest
Current Estimated Value
Home Financials for this Owner
Home Financials are based on the most recent Mortgage that was taken out on this home.
Original Mortgage
$202,500
Outstanding Balance
$152,359
Interest Rate
3.21%
Mortgage Type
FHA
Estimated Equity
$174,382
Purchase Details
Closed on
Feb 20, 2015
Sold by
Henderson Carolyn
Bought by
Henderson Ernest and Henderson Carolyn K
Home Financials for this Owner
Home Financials are based on the most recent Mortgage that was taken out on this home.
Original Mortgage
$202,500
Outstanding Balance
$152,359
Interest Rate
3.21%
Mortgage Type
FHA
Estimated Equity
$174,382
Purchase Details
Closed on
Dec 23, 2013
Sold by
Border Hans M
Bought by
Key Larry
Purchase Details
Closed on
Jul 16, 2013
Sold by
Oquinn Michael A
Bought by
Key Thomas E
Create a Home Valuation Report for This Property
The Home Valuation Report is an in-depth analysis detailing your home's value as well as a comparison with similar homes in the area
Home Values in the Area
Average Home Value in this Area
Purchase History
| Date | Buyer | Sale Price | Title Company |
|---|---|---|---|
| Henderson Ernest | -- | -- | |
| Henderson Ernest | -- | -- | |
| Key Larry | -- | -- | |
| Henderson Carolyn Key | -- | -- | |
| Key Thomas E | -- | -- |
Source: Public Records
Mortgage History
| Date | Status | Borrower | Loan Amount |
|---|---|---|---|
| Open | Henderson Ernest | $202,500 |
Source: Public Records
Tax History Compared to Growth
Tax History
| Year | Tax Paid | Tax Assessment Tax Assessment Total Assessment is a certain percentage of the fair market value that is determined by local assessors to be the total taxable value of land and additions on the property. | Land | Improvement |
|---|---|---|---|---|
| 2025 | $676 | $147,980 | $43,960 | $104,020 |
| 2024 | $676 | $127,880 | $39,600 | $88,280 |
| 2023 | $481 | $127,080 | $38,120 | $88,960 |
| 2022 | $616 | $104,880 | $35,200 | $69,680 |
| 2021 | $594 | $84,680 | $30,200 | $54,480 |
| 2020 | $589 | $77,680 | $28,440 | $49,240 |
| 2019 | $585 | $70,120 | $26,960 | $43,160 |
| 2018 | $580 | $64,720 | $24,920 | $39,800 |
| 2016 | $572 | $55,480 | $22,000 | $33,480 |
| 2015 | $2,057 | $51,000 | $21,120 | $29,880 |
| 2014 | $2,020 | $49,480 | $21,120 | $28,360 |
Source: Public Records
Map
Nearby Homes
- 103 N Circle Dr
- 107 S Circle Dr
- 4587 Lombard Rd
- 69 N Hearn Rd
- 4024 Lucas Ln
- 5520 Hearn Rd
- 3927 Scarlet Ohara Dr
- 444 Cauthen Ct
- 4564 Investors Ln
- 4923 Amsler Rd
- 270 Huckleberry Ln
- 0 Kingsbrook Dr Unit 19 LOTS 10399843
- 4824 Flakes Mill Rd
- 168 Chapel Ridge Dr
- 4329 Traipse Path
- 4241 Hearn Rd
- 160 Chapel Ridge Dr
- 4583 Carissa Ct Unit 7
- 1414 Panola Rd
- 4676 Lake Vista Cir