Estimated Value: $207,000 - $280,000
2
Beds
2
Baths
1,284
Sq Ft
$200/Sq Ft
Est. Value
About This Home
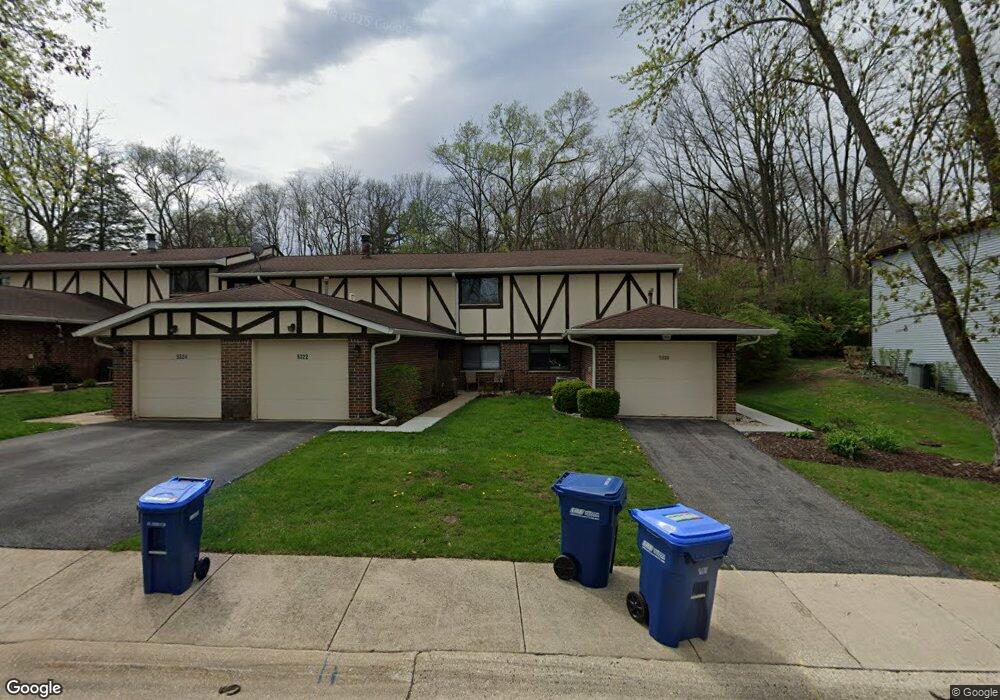
This home is located at 5322 Newport Dr Unit 2, Lisle, IL 60532 and is currently estimated at $256,928, approximately $200 per square foot. 5322 Newport Dr Unit 2 is a home located in DuPage County with nearby schools including Lisle Elementary School, Lisle Jr High School, and Lisle High School.
Ownership History
Date
Name
Owned For
Owner Type
Purchase Details
Closed on
Jun 28, 2017
Sold by
Chlopek Sylvia
Bought by
Williams Christine A
Current Estimated Value
Home Financials for this Owner
Home Financials are based on the most recent Mortgage that was taken out on this home.
Original Mortgage
$165,870
Outstanding Balance
$138,673
Interest Rate
4.12%
Mortgage Type
New Conventional
Estimated Equity
$118,255
Purchase Details
Closed on
Oct 15, 1999
Sold by
Donahue Peter A and Donahue Lynn M
Bought by
Chlopek Sylvia
Home Financials for this Owner
Home Financials are based on the most recent Mortgage that was taken out on this home.
Original Mortgage
$88,000
Interest Rate
7.91%
Purchase Details
Closed on
Jan 24, 1996
Sold by
Smith Rita Rebecca
Bought by
Donahue Peter A and Donahue Lynn M
Home Financials for this Owner
Home Financials are based on the most recent Mortgage that was taken out on this home.
Original Mortgage
$102,600
Interest Rate
7.11%
Create a Home Valuation Report for This Property
The Home Valuation Report is an in-depth analysis detailing your home's value as well as a comparison with similar homes in the area
Home Values in the Area
Average Home Value in this Area
Purchase History
| Date | Buyer | Sale Price | Title Company |
|---|---|---|---|
| Williams Christine A | $171,000 | Home Closing Services Inc | |
| Chlopek Sylvia | $119,000 | First American Title Ins | |
| Donahue Peter A | $108,000 | -- |
Source: Public Records
Mortgage History
| Date | Status | Borrower | Loan Amount |
|---|---|---|---|
| Open | Williams Christine A | $165,870 | |
| Previous Owner | Chlopek Sylvia | $88,000 | |
| Previous Owner | Donahue Peter A | $102,600 |
Source: Public Records
Tax History Compared to Growth
Tax History
| Year | Tax Paid | Tax Assessment Tax Assessment Total Assessment is a certain percentage of the fair market value that is determined by local assessors to be the total taxable value of land and additions on the property. | Land | Improvement |
|---|---|---|---|---|
| 2024 | $4,101 | $64,417 | $8,273 | $56,144 |
| 2023 | $3,899 | $58,790 | $7,550 | $51,240 |
| 2022 | $3,859 | $57,140 | $7,340 | $49,800 |
| 2021 | $3,737 | $54,980 | $7,060 | $47,920 |
| 2020 | $3,577 | $53,990 | $6,930 | $47,060 |
| 2019 | $3,507 | $51,650 | $6,630 | $45,020 |
| 2018 | $3,044 | $45,710 | $5,870 | $39,840 |
| 2017 | $2,290 | $44,170 | $5,670 | $38,500 |
| 2016 | $2,326 | $42,570 | $5,460 | $37,110 |
| 2015 | $2,448 | $40,090 | $5,140 | $34,950 |
| 2014 | $2,469 | $40,090 | $5,140 | $34,950 |
| 2013 | $2,793 | $44,640 | $5,720 | $38,920 |
Source: Public Records
Map
Nearby Homes
- 5305 Newport Dr Unit 3
- 5355 Newport Dr Unit 46C
- 1874 Portsmouth Dr Unit 66C
- 1822 Portsmouth Dr Unit 2
- 2007 Ohio St
- 6269 Lafond Cir
- 6222 Lafond Cir
- 6224 Lafond Cir
- 6259 Lafond Cir
- 6210 Rivers Edge Dr
- 6225 Rivers Edge Dr
- 6226 Lafond Cir
- 6230 Lafond Cir
- 6279 Lee Ct
- 6284 Lee Ct
- 6260 Lafond Cir
- 25W054 (Lot 4) Burlington Ave
- 6282 Lee Ct
- 6280 Lee Ct
- 6235 Lafond Cir
- 5320 Newport Dr Unit 1
- 5324 Newport Dr
- 5326 Newport Dr Unit 4
- 5310 Newport Dr
- 5308 Newport Dr Unit 5
- 5328 Newport Dr
- 5306 Newport Dr Unit 4
- 5330 Newport Dr Unit 6
- 5304 Newport Dr
- 5311 Newport Dr Unit 6
- 2305 Newport Dr
- 5300 Newport Dr
- 5309 Newport Dr Unit 5
- 5321 Newport Dr Unit 1
- 5307 Newport Dr Unit 4
- 5325 Newport Dr Unit 3
- 1 Newport Dr
- 5327 Newport Dr
- 5350 Newport Dr Unit 2A
- 5352 Newport Dr Unit 11B