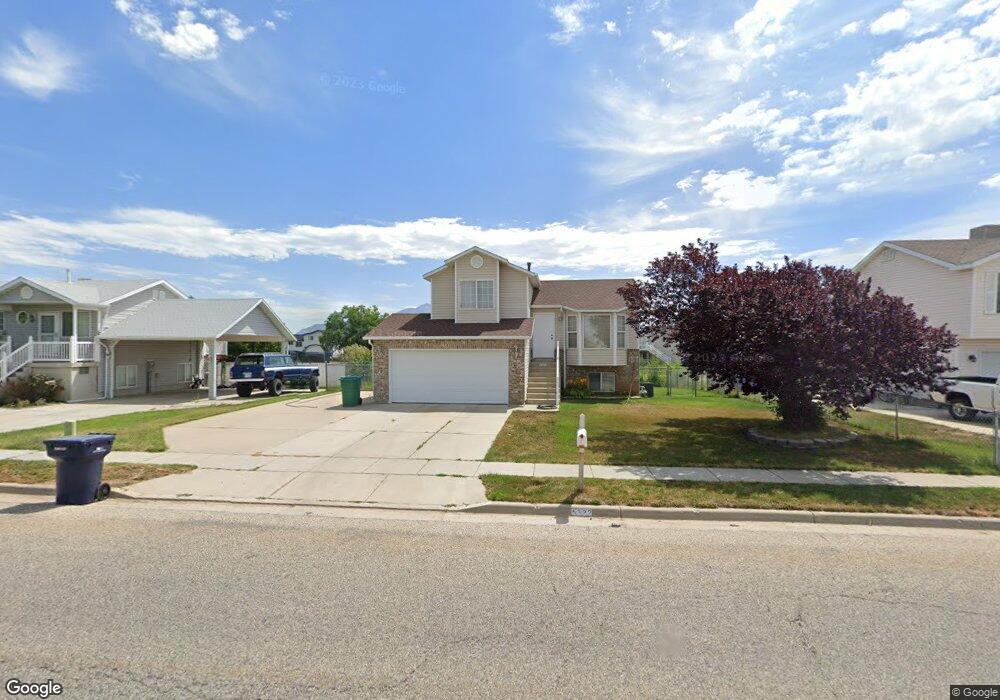
5322 S 4300 W Hooper, UT 84315
Estimated Value: $395,822 - $414,000
2
Beds
1
Bath
1,431
Sq Ft
$282/Sq Ft
Est. Value
About This Home
This home is located at 5322 S 4300 W, Hooper, UT 84315 and is currently estimated at $403,206, approximately $281 per square foot. 5322 S 4300 W is a home located in Weber County with nearby schools including Freedom School, Roy Junior High School, and Roy High School.
Ownership History
Date
Name
Owned For
Owner Type
Purchase Details
Closed on
Apr 26, 2001
Sold by
Parks Chris and Parks Sherri L
Bought by
Miller Monte L
Current Estimated Value
Home Financials for this Owner
Home Financials are based on the most recent Mortgage that was taken out on this home.
Original Mortgage
$120,721
Outstanding Balance
$44,910
Interest Rate
6.98%
Estimated Equity
$358,296
Purchase Details
Closed on
Dec 3, 1997
Sold by
Baucorp Co
Bought by
Parks Chris and Parks Sherri L
Home Financials for this Owner
Home Financials are based on the most recent Mortgage that was taken out on this home.
Original Mortgage
$93,538
Interest Rate
7.31%
Mortgage Type
FHA
Purchase Details
Closed on
Dec 24, 1996
Sold by
Baucorp Co
Bought by
Parks Chris and Hoggan Sherri L
Home Financials for this Owner
Home Financials are based on the most recent Mortgage that was taken out on this home.
Original Mortgage
$76,800
Interest Rate
10.25%
Create a Home Valuation Report for This Property
The Home Valuation Report is an in-depth analysis detailing your home's value as well as a comparison with similar homes in the area
Home Values in the Area
Average Home Value in this Area
Purchase History
| Date | Buyer | Sale Price | Title Company |
|---|---|---|---|
| Miller Monte L | -- | Associated Title | |
| Parks Chris | -- | First American Title | |
| Baucorp Co | -- | First American Title | |
| Parks Chris | -- | First American Title |
Source: Public Records
Mortgage History
| Date | Status | Borrower | Loan Amount |
|---|---|---|---|
| Open | Miller Monte L | $120,721 | |
| Previous Owner | Parks Chris | $93,538 | |
| Previous Owner | Parks Chris | $76,800 |
Source: Public Records
Tax History Compared to Growth
Tax History
| Year | Tax Paid | Tax Assessment Tax Assessment Total Assessment is a certain percentage of the fair market value that is determined by local assessors to be the total taxable value of land and additions on the property. | Land | Improvement |
|---|---|---|---|---|
| 2025 | $2,311 | $360,875 | $120,013 | $240,862 |
| 2024 | $2,257 | $195,249 | $66,007 | $129,242 |
| 2023 | $2,217 | $192,500 | $65,968 | $126,532 |
| 2022 | $2,468 | $223,300 | $57,754 | $165,546 |
| 2021 | $1,901 | $280,000 | $80,017 | $199,983 |
| 2020 | $1,868 | $254,000 | $80,017 | $173,983 |
| 2019 | $1,750 | $223,000 | $45,015 | $177,985 |
| 2018 | $1,670 | $200,000 | $42,015 | $157,985 |
| 2017 | $1,572 | $176,000 | $42,015 | $133,985 |
| 2016 | $1,505 | $90,430 | $21,415 | $69,015 |
| 2015 | $1,310 | $79,609 | $21,415 | $58,194 |
| 2014 | $1,196 | $70,808 | $18,736 | $52,072 |
Source: Public Records
Map
Nearby Homes
- 4337 W 5430 S Unit A
- 5270 S 4200 W
- 5116 S 4300 W
- 4342 W 5430 S Unit B
- 4309 W 5430 St #B S
- 4449 W 5325 S
- 4218 W 5050 S
- 5013 S 4150 W
- 5539 S 4175 W
- 5465 S 4050 W
- 5235 Midland Dr
- 4990 S 4075 W
- 4021 W 5000 S
- 4141 W 4875 S
- 4890 S 4075 W
- 4556 W 4950 S
- 4106 W 4875 S
- 5644 S 4075 W
- 4756 S 4300 W
- 4700 W 5500 S