5322 Weatherside Ln Langley, WA 98260
Estimated Value: $959,642 - $1,112,000
3
Beds
4
Baths
3,361
Sq Ft
$306/Sq Ft
Est. Value
About This Home
This home is located at 5322 Weatherside Ln, Langley, WA 98260 and is currently estimated at $1,026,911, approximately $305 per square foot. 5322 Weatherside Ln is a home located in Island County with nearby schools including South Whidbey Elementary School, South Whidbey Middle School, and South Whidbey High School.
Ownership History
Date
Name
Owned For
Owner Type
Purchase Details
Closed on
Jan 25, 2018
Sold by
Mclnerney Tanner M
Bought by
Mclnerney Tanner M and Mclnerney Amy K
Current Estimated Value
Home Financials for this Owner
Home Financials are based on the most recent Mortgage that was taken out on this home.
Original Mortgage
$392,000
Outstanding Balance
$330,717
Interest Rate
3.93%
Mortgage Type
New Conventional
Estimated Equity
$696,194
Purchase Details
Closed on
Jan 22, 2018
Sold by
Mclnerney Tanner M
Bought by
Mcinerney Tanner M and Mcinerney Amy K
Home Financials for this Owner
Home Financials are based on the most recent Mortgage that was taken out on this home.
Original Mortgage
$392,000
Outstanding Balance
$330,717
Interest Rate
3.93%
Mortgage Type
New Conventional
Estimated Equity
$696,194
Purchase Details
Closed on
Mar 14, 2017
Sold by
Wolff Michael
Bought by
Mcinerney Tanner
Home Financials for this Owner
Home Financials are based on the most recent Mortgage that was taken out on this home.
Original Mortgage
$105,000
Interest Rate
4.19%
Mortgage Type
Seller Take Back
Purchase Details
Closed on
Jun 28, 2010
Sold by
Gabelein Kathie A and Brown Kristi L
Bought by
Mcinerney Tanner Miles
Home Financials for this Owner
Home Financials are based on the most recent Mortgage that was taken out on this home.
Original Mortgage
$248,000
Interest Rate
2.75%
Mortgage Type
New Conventional
Create a Home Valuation Report for This Property
The Home Valuation Report is an in-depth analysis detailing your home's value as well as a comparison with similar homes in the area
Home Values in the Area
Average Home Value in this Area
Purchase History
| Date | Buyer | Sale Price | Title Company |
|---|---|---|---|
| Mclnerney Tanner M | -- | Stewart Title | |
| Mcinerney Tanner M | -- | Premier Title Of Island Coun | |
| Mcinerney Tanner | $120,000 | None Available | |
| Mcinerney Tanner Miles | $248,000 | None Available |
Source: Public Records
Mortgage History
| Date | Status | Borrower | Loan Amount |
|---|---|---|---|
| Open | Mclnerney Tanner M | $392,000 | |
| Closed | Mcinerney Tanner M | $392,000 | |
| Previous Owner | Mcinerney Tanner | $105,000 | |
| Previous Owner | Mcinerney Tanner Miles | $248,000 |
Source: Public Records
Tax History Compared to Growth
Tax History
| Year | Tax Paid | Tax Assessment Tax Assessment Total Assessment is a certain percentage of the fair market value that is determined by local assessors to be the total taxable value of land and additions on the property. | Land | Improvement |
|---|---|---|---|---|
| 2025 | $4,103 | $820,572 | $310,000 | $510,572 |
| 2024 | $4,103 | $629,019 | $290,000 | $339,019 |
| 2023 | $4,103 | $623,767 | $290,000 | $333,767 |
| 2022 | $3,631 | $569,654 | $270,000 | $299,654 |
| 2021 | $3,323 | $453,824 | $190,000 | $263,824 |
| 2020 | $2,623 | $423,095 | $165,000 | $258,095 |
| 2019 | $2,414 | $341,274 | $200,000 | $141,274 |
| 2018 | $2,447 | $311,800 | $170,000 | $141,800 |
| 2017 | $2,176 | $292,849 | $150,000 | $142,849 |
| 2016 | $1,937 | $284,951 | $140,000 | $144,951 |
| 2015 | -- | $244,802 | $97,750 | $147,052 |
| 2013 | -- | $250,366 | $97,750 | $152,616 |
Source: Public Records
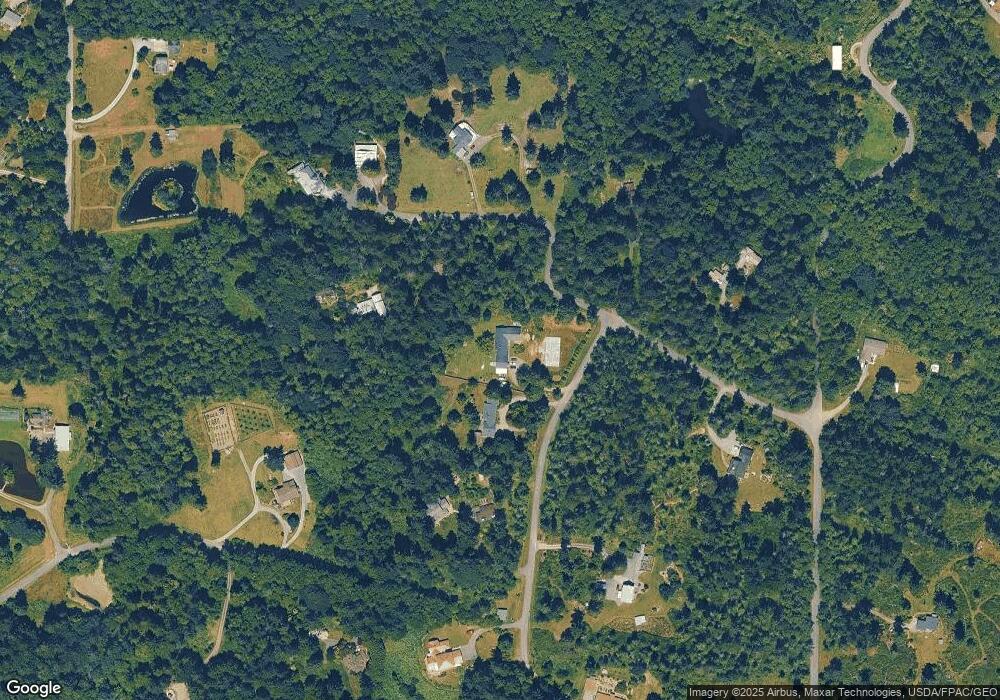
Map
Nearby Homes
- 0 Lot 7 Thompson Rd
- 1774 Twin Oaks Ln
- 0 XXX E Harbor Rd
- 1821 Watkins Rd
- 1857 Watkins Rd
- 2013 Goss Ridge Rd
- 1940 Cattail Ln
- 5222 E Harbor Rd
- 1865 Crestwood Cove Ct
- 0 xxx S Farmers Ln
- 1738 Alliance Ave Unit 14
- 0 XXX Osprey Rd Unit 15-1
- 0 XXX Osprey Rd (15-1 & 15-2)
- 0 XXX Osprey Rd Unit 15-2
- 2575 Hillis Dr
- 2568 Myra Place
- 5772 Captain Vancouver Dr
- 4945 Lakeside Dr
- 0 Lynne Dr
- 5591 S Harbor Ave
- 5332 Weatherside Ln
- 2157 Clearview Ln
- 5365 Weatherside Ln
- 2209 Clearview Ln
- 2174 Clearview Ln
- 2154 Clearview Ln
- 2154 Clearview Ln
- 2235 Clearview Ln
- 2125 Myres Ln
- 2230 Clearview Ln
- 5373 Weatherside Ln
- 5386 Weatherside Ln
- 2142 Myres Ln
- 5343 Emil Rd
- 5396 Weatherside Ln
- 5274 Emil Rd
- 2206 Woodbine Rd
- 5281 Hawthorne Ln
- 2208 Woodbine Rd
- 2138 Myres Ln