5323 5th Ave Brooklyn, NY 11220
Sunset Park NeighborhoodEstimated Value: $18,655,490
--
Bed
--
Bath
31,500
Sq Ft
$592/Sq Ft
Est. Value
About This Home
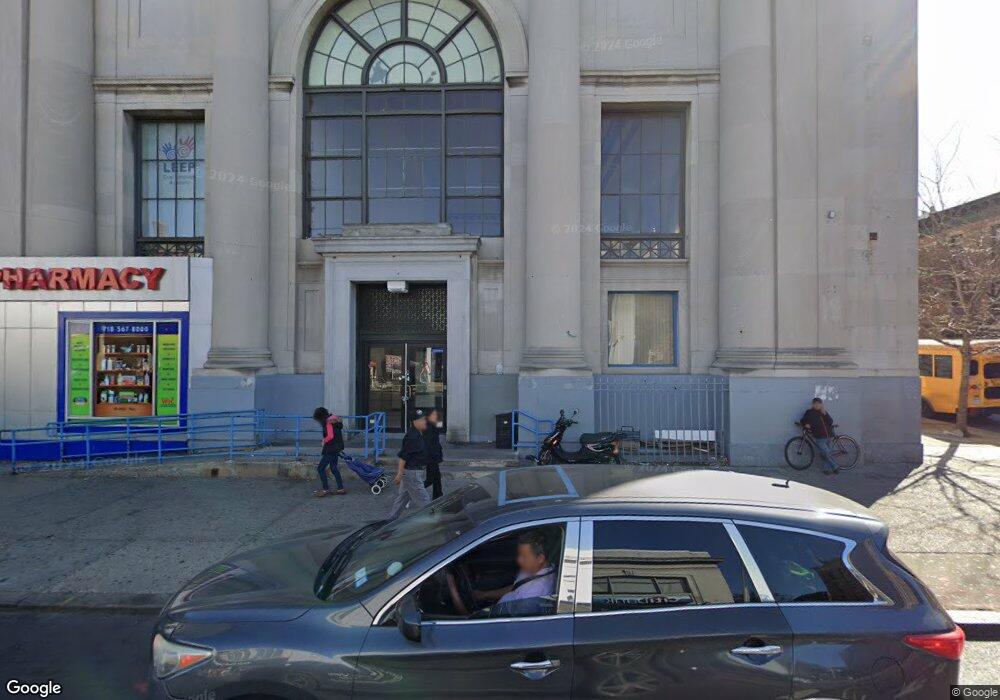
This home is located at 5323 5th Ave, Brooklyn, NY 11220 and is currently estimated at $18,655,490, approximately $592 per square foot. 5323 5th Ave is a home located in Kings County with nearby schools including P.S. 1 The Bergen, IS 220 John J. Pershing, and Leep Dual Language Academy Charter School.
Ownership History
Date
Name
Owned For
Owner Type
Purchase Details
Closed on
Jul 25, 2006
Sold by
5Th Avenue Brooklyn Llc
Bought by
Sunset 5Th Llc
Current Estimated Value
Home Financials for this Owner
Home Financials are based on the most recent Mortgage that was taken out on this home.
Original Mortgage
$1,815,506
Outstanding Balance
$1,086,723
Interest Rate
6.8%
Mortgage Type
Commercial
Estimated Equity
$17,568,767
Purchase Details
Closed on
Dec 30, 1999
Sold by
The Dime Svgs Bank Of New York Fsb
Bought by
5Th Avenue Brooklyn Llc
Home Financials for this Owner
Home Financials are based on the most recent Mortgage that was taken out on this home.
Original Mortgage
$2,200,000
Interest Rate
8.15%
Mortgage Type
Commercial
Create a Home Valuation Report for This Property
The Home Valuation Report is an in-depth analysis detailing your home's value as well as a comparison with similar homes in the area
Home Values in the Area
Average Home Value in this Area
Purchase History
| Date | Buyer | Sale Price | Title Company |
|---|---|---|---|
| Sunset 5Th Llc | $10,100,000 | -- | |
| 5Th Avenue Brooklyn Llc | $1,850,000 | -- |
Source: Public Records
Mortgage History
| Date | Status | Borrower | Loan Amount |
|---|---|---|---|
| Open | Sunset 5Th Llc | $1,815,506 | |
| Previous Owner | 5Th Avenue Brooklyn Llc | $2,200,000 |
Source: Public Records
Tax History Compared to Growth
Tax History
| Year | Tax Paid | Tax Assessment Tax Assessment Total Assessment is a certain percentage of the fair market value that is determined by local assessors to be the total taxable value of land and additions on the property. | Land | Improvement |
|---|---|---|---|---|
| 2025 | $210,105 | $2,260,800 | $337,500 | $1,923,300 |
| 2024 | $210,105 | $2,234,250 | $337,500 | $1,896,750 |
| 2023 | $201,583 | $2,196,000 | $337,500 | $1,858,500 |
| 2022 | $182,350 | $1,979,550 | $337,500 | $1,642,050 |
| 2021 | $176,354 | $2,172,600 | $337,500 | $1,835,100 |
| 2020 | $81,980 | $2,187,900 | $337,500 | $1,850,400 |
| 2019 | $150,650 | $2,067,750 | $337,500 | $1,730,250 |
| 2018 | $143,487 | $1,964,250 | $298,800 | $1,665,450 |
| 2017 | $117,824 | $1,896,300 | $298,800 | $1,597,500 |
| 2016 | $116,736 | $1,890,000 | $298,800 | $1,591,200 |
| 2015 | $41,885 | $1,738,800 | $298,800 | $1,440,000 |
| 2014 | $41,885 | $1,650,150 | $298,800 | $1,351,350 |
Source: Public Records
Map
Nearby Homes