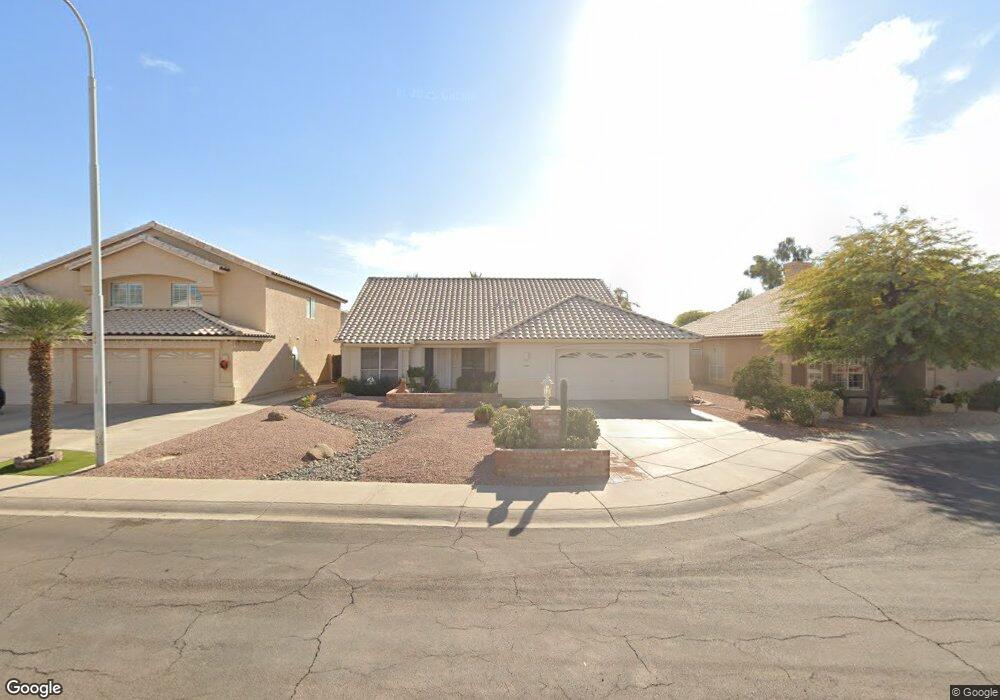
5323 W Harrison Ct Chandler, AZ 85226
West Chandler NeighborhoodEstimated Value: $516,843 - $634,000
4
Beds
2
Baths
1,832
Sq Ft
$317/Sq Ft
Est. Value
About This Home
This home is located at 5323 W Harrison Ct, Chandler, AZ 85226 and is currently estimated at $580,711, approximately $316 per square foot. 5323 W Harrison Ct is a home located in Maricopa County with nearby schools including Kyrene de la Mirada Elementary School, Kyrene del Pueblo Middle School, and Corona Del Sol High School.
Ownership History
Date
Name
Owned For
Owner Type
Purchase Details
Closed on
Nov 22, 2004
Sold by
Bashford Troy H and Bashford Lisa
Bought by
Clair Jeffrey S and Clair Jae E
Current Estimated Value
Purchase Details
Closed on
Mar 7, 2002
Sold by
Bashford Troy H
Bought by
Bashford Troy H and Bashford Lisa
Home Financials for this Owner
Home Financials are based on the most recent Mortgage that was taken out on this home.
Original Mortgage
$160,000
Interest Rate
6.5%
Purchase Details
Closed on
Jul 2, 1998
Sold by
Vanwie Lisa
Bought by
Bashford Troy H
Purchase Details
Closed on
Oct 16, 1996
Sold by
Martin Scott B
Bought by
Martin Londa L
Home Financials for this Owner
Home Financials are based on the most recent Mortgage that was taken out on this home.
Original Mortgage
$30,000
Interest Rate
8.3%
Create a Home Valuation Report for This Property
The Home Valuation Report is an in-depth analysis detailing your home's value as well as a comparison with similar homes in the area
Home Values in the Area
Average Home Value in this Area
Purchase History
| Date | Buyer | Sale Price | Title Company |
|---|---|---|---|
| Clair Jeffrey S | $259,900 | Grand Canyon Title Agency In | |
| Bashford Troy H | -- | Title Guaranty Agency | |
| Bashford Troy H | -- | Capital Title Agency | |
| Bashford Troy H | $166,500 | Capital Title Agency | |
| Martin Londa L | -- | -- |
Source: Public Records
Mortgage History
| Date | Status | Borrower | Loan Amount |
|---|---|---|---|
| Previous Owner | Bashford Troy H | $160,000 | |
| Previous Owner | Martin Londa L | $30,000 |
Source: Public Records
Tax History Compared to Growth
Tax History
| Year | Tax Paid | Tax Assessment Tax Assessment Total Assessment is a certain percentage of the fair market value that is determined by local assessors to be the total taxable value of land and additions on the property. | Land | Improvement |
|---|---|---|---|---|
| 2025 | $2,429 | $30,497 | -- | -- |
| 2024 | $2,324 | $29,045 | -- | -- |
| 2023 | $2,324 | $42,320 | $8,460 | $33,860 |
| 2022 | $2,212 | $32,500 | $6,500 | $26,000 |
| 2021 | $2,332 | $30,480 | $6,090 | $24,390 |
| 2020 | $2,279 | $28,950 | $5,790 | $23,160 |
| 2019 | $2,212 | $27,700 | $5,540 | $22,160 |
| 2018 | $2,140 | $26,410 | $5,280 | $21,130 |
| 2017 | $2,039 | $26,230 | $5,240 | $20,990 |
| 2016 | $2,081 | $25,680 | $5,130 | $20,550 |
| 2015 | $1,921 | $24,050 | $4,810 | $19,240 |
Source: Public Records
Map
Nearby Homes
- 5291 W Del Rio St
- 881 N Pineview Dr
- 5170 W Ivanhoe St
- 5665 W Galveston St Unit 76
- 5726 W Ivanhoe St
- 4772 W Joshua Blvd
- 500 N Gila Springs Blvd Unit 230
- 500 N Gila Springs Blvd Unit 113
- 5751 W Del Rio St
- 547 N Maple St
- 4830 W Shannon Ct
- 4820 W Shannon Ct
- 5959 W Del Rio St
- 295 N Rural Rd Unit 160
- 295 N Rural Rd Unit 128
- 295 N Rural Rd Unit 202
- 4922 W Gail Dr
- 5151 W Glenview Place
- 300 N Gila Springs Blvd Unit 181
- 5455 W Buffalo St
- 5313 W Harrison Ct
- 5333 W Harrison Ct
- 5303 W Harrison Ct
- 5320 W Del Rio St
- 5310 W Del Rio St
- 5330 W Del Rio St
- 5353 W Harrison Ct
- 5300 W Del Rio St
- 5293 W Harrison Ct
- 5312 W Harrison Ct
- 5322 W Harrison Ct
- 5350 W Del Rio St
- 5302 W Harrison Ct Unit 2
- 5363 W Harrison Ct Unit 2
- 5332 W Harrison Ct
- 5290 W Del Rio St
- 5292 W Harrison Ct
- 5283 W Harrison Ct
- 5360 W Del Rio St
- 5352 W Harrison Ct