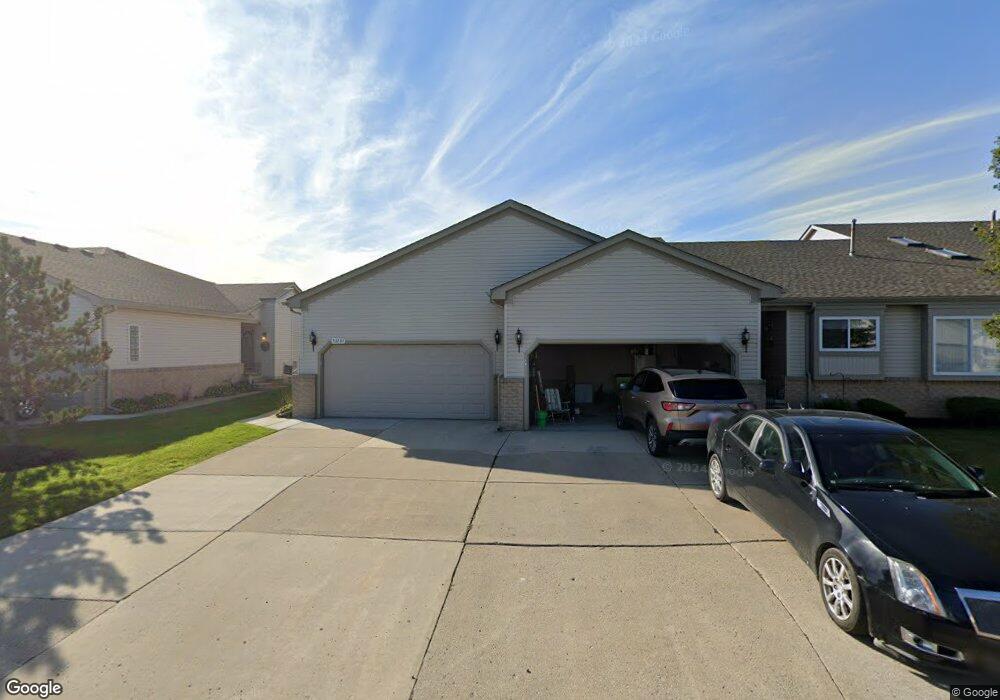
53233 Butternut St Unit 218 Chesterfield, MI 48051
Estimated Value: $245,617 - $262,000
2
Beds
2
Baths
1,234
Sq Ft
$205/Sq Ft
Est. Value
About This Home
This home is located at 53233 Butternut St Unit 218, Chesterfield, MI 48051 and is currently estimated at $253,154, approximately $205 per square foot. 53233 Butternut St Unit 218 is a home located in Macomb County with nearby schools including Francis A. Higgins Elementary School, L'Anse Creuse High School - North, and Merritt Academy.
Ownership History
Date
Name
Owned For
Owner Type
Purchase Details
Closed on
Sep 3, 2010
Sold by
Davies James A and Davies Nancy J
Bought by
Davies James A and Davies Nancy J
Current Estimated Value
Home Financials for this Owner
Home Financials are based on the most recent Mortgage that was taken out on this home.
Original Mortgage
$132,000
Outstanding Balance
$87,208
Interest Rate
4.45%
Mortgage Type
Reverse Mortgage Home Equity Conversion Mortgage
Estimated Equity
$165,946
Purchase Details
Closed on
Apr 29, 2005
Sold by
Mccluskey Mary Ann
Bought by
Davies James A and Davies Nancy J
Purchase Details
Closed on
Jul 19, 2004
Sold by
Mcluskey Dennis Michael and Mccluskey Mary Ann
Bought by
Mccluskey Mary Ann
Purchase Details
Closed on
Mar 6, 2001
Sold by
Seville Homes Inc
Bought by
Mccluskey Dennis M
Create a Home Valuation Report for This Property
The Home Valuation Report is an in-depth analysis detailing your home's value as well as a comparison with similar homes in the area
Home Values in the Area
Average Home Value in this Area
Purchase History
| Date | Buyer | Sale Price | Title Company |
|---|---|---|---|
| Davies James A | -- | None Available | |
| Davies James A | $168,900 | Devon Title Agency | |
| Mccluskey Mary Ann | -- | Chicago Title Insurance Co | |
| Mccluskey Dennis M | $139,900 | -- |
Source: Public Records
Mortgage History
| Date | Status | Borrower | Loan Amount |
|---|---|---|---|
| Open | Davies James A | $132,000 |
Source: Public Records
Tax History Compared to Growth
Tax History
| Year | Tax Paid | Tax Assessment Tax Assessment Total Assessment is a certain percentage of the fair market value that is determined by local assessors to be the total taxable value of land and additions on the property. | Land | Improvement |
|---|---|---|---|---|
| 2025 | $2,056 | $115,600 | $0 | $0 |
| 2024 | $1,408 | $109,600 | $0 | $0 |
| 2023 | $1,335 | $91,600 | $0 | $0 |
| 2022 | $1,860 | $83,600 | $0 | $0 |
| 2021 | $1,809 | $82,200 | $0 | $0 |
| 2020 | $1,226 | $81,800 | $0 | $0 |
| 2019 | $1,599 | $75,400 | $0 | $0 |
| 2018 | $1,635 | $73,300 | $7,500 | $65,800 |
| 2017 | $1,601 | $66,700 | $7,500 | $59,200 |
| 2016 | $1,599 | $66,700 | $0 | $0 |
| 2015 | $540 | $61,300 | $0 | $0 |
| 2014 | $540 | $49,400 | $3,750 | $45,650 |
| 2012 | -- | $0 | $0 | $0 |
Source: Public Records
Map
Nearby Homes
- 53261 Butternut St
- 53064 Barberry Cir
- 53153 Gratiot Ave
- 29321 Debbie Dr Unit 43
- 29326 Debbie Dr Unit 54
- N W Corner 24 Mile & Gratiot Ave
- 53724 Newberry Dr Unit 127
- 29181 Philadelphia Dr Unit 40
- 29280 Classic Dr Unit 115
- 53218 Elysia Dr
- 53754 Traditional Dr Unit 66
- 53925 Andrew Dr
- 29008 Pinehurst Dr
- 53091 W Ridge Dr
- 0 Gratiot Ave
- 52563 Pineview Cir Unit 189
- 29310 Jamestown Dr
- 30095 Pineview Cir Unit 8
- 29751 Hiram Ct
- 30032 Pineview Cir
- 53237 Butternut St Unit 217
- 53249 Butternut St
- 53253 Butternut St
- 53254 Butternut St
- 53250 Butternut St
- 53246 Butternut St
- 53242 Butternut St
- 53238 Butternut St Unit 180
- 53234 Butternut St
- 53250 Butternut St Unit 183
- 53242 Butternut St Unit 644
- 53256 Glen Oak Dr
- 53264 Glen Oak Dr Unit 234
- 53268 Glen Oak Dr Unit 233
- 53272 Glen Oak Dr Unit 232
- 53276 Glen Oak Dr Unit 231
- 53256 Glen Oak Dr Unit 236
- 53274 Butternut St Unit 188
- 53225 Butternut St
- 53252 Glen Oak Dr