Estimated Value: $337,000 - $372,793
4
Beds
2
Baths
1,728
Sq Ft
$206/Sq Ft
Est. Value
About This Home
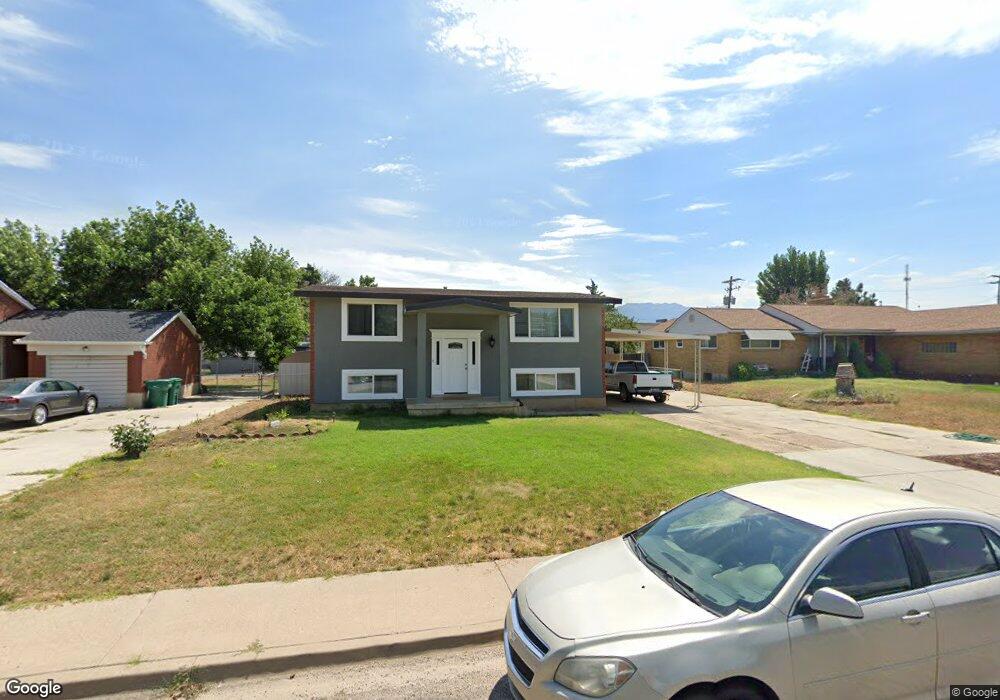
This home is located at 5324 S 2000 W, Roy, UT 84067 and is currently estimated at $355,198, approximately $205 per square foot. 5324 S 2000 W is a home located in Weber County with nearby schools including Lakeview Elementary School, Roy Junior High School, and Roy High School.
Ownership History
Date
Name
Owned For
Owner Type
Purchase Details
Closed on
Oct 25, 2020
Sold by
Hoopes Randy L and Hoopes Corinne
Bought by
Herrera Marta Ylia and Martinez Hugo Alberto
Current Estimated Value
Home Financials for this Owner
Home Financials are based on the most recent Mortgage that was taken out on this home.
Original Mortgage
$247,926
Interest Rate
2.9%
Mortgage Type
FHA
Purchase Details
Closed on
May 11, 2020
Sold by
Ylia Herrera Marta
Bought by
Cibrian Elio G
Home Financials for this Owner
Home Financials are based on the most recent Mortgage that was taken out on this home.
Original Mortgage
$277,000
Interest Rate
3.76%
Mortgage Type
New Conventional
Create a Home Valuation Report for This Property
The Home Valuation Report is an in-depth analysis detailing your home's value as well as a comparison with similar homes in the area
Home Values in the Area
Average Home Value in this Area
Purchase History
| Date | Buyer | Sale Price | Title Company |
|---|---|---|---|
| Herrera Marta Ylia | -- | Metro National Title | |
| Cibrian Elio G | -- | 1St Liberty Title |
Source: Public Records
Mortgage History
| Date | Status | Borrower | Loan Amount |
|---|---|---|---|
| Previous Owner | Herrera Marta Ylia | $247,926 | |
| Previous Owner | Cibrian Elio G | $277,000 |
Source: Public Records
Tax History Compared to Growth
Tax History
| Year | Tax Paid | Tax Assessment Tax Assessment Total Assessment is a certain percentage of the fair market value that is determined by local assessors to be the total taxable value of land and additions on the property. | Land | Improvement |
|---|---|---|---|---|
| 2025 | $2,154 | $332,108 | $122,630 | $209,478 |
| 2024 | $2,106 | $179,849 | $67,447 | $112,402 |
| 2023 | $2,032 | $173,800 | $64,239 | $109,561 |
| 2022 | $1,868 | $162,800 | $55,729 | $107,071 |
| 2021 | $1,726 | $250,000 | $71,154 | $178,846 |
| 2020 | $1,511 | $199,000 | $71,154 | $127,846 |
| 2019 | $1,497 | $186,000 | $40,995 | $145,005 |
| 2018 | $1,319 | $152,000 | $35,927 | $116,073 |
| 2017 | $1,278 | $138,000 | $35,927 | $102,073 |
| 2016 | $1,231 | $71,417 | $16,519 | $54,898 |
| 2015 | $1,058 | $61,555 | $16,519 | $45,036 |
| 2014 | $1,035 | $59,427 | $16,519 | $42,908 |
Source: Public Records
Map
Nearby Homes
- 5185 S 2100 W
- 5140 S 2100 W
- 5333 S 2200 W
- 5289 S 2200 W
- 5261 S 2200 W
- 2184 W 5500 S
- 5140 S 2175 W
- 5545 S 2100 W Unit 12
- 5545 S 2100 W Unit 20
- 5545 S 2100 W Unit D22
- 2146 W 5600 S Unit 29
- 2266 W 5100 S
- 2179 W 4975 S
- 1789 W 5050 S
- 1777 W 5050 S
- 5643 S 2200 W
- 1758 W 5025 S
- 5345 S 2425 W
- 5006 S 1800 W
- 1765 W 5000 S