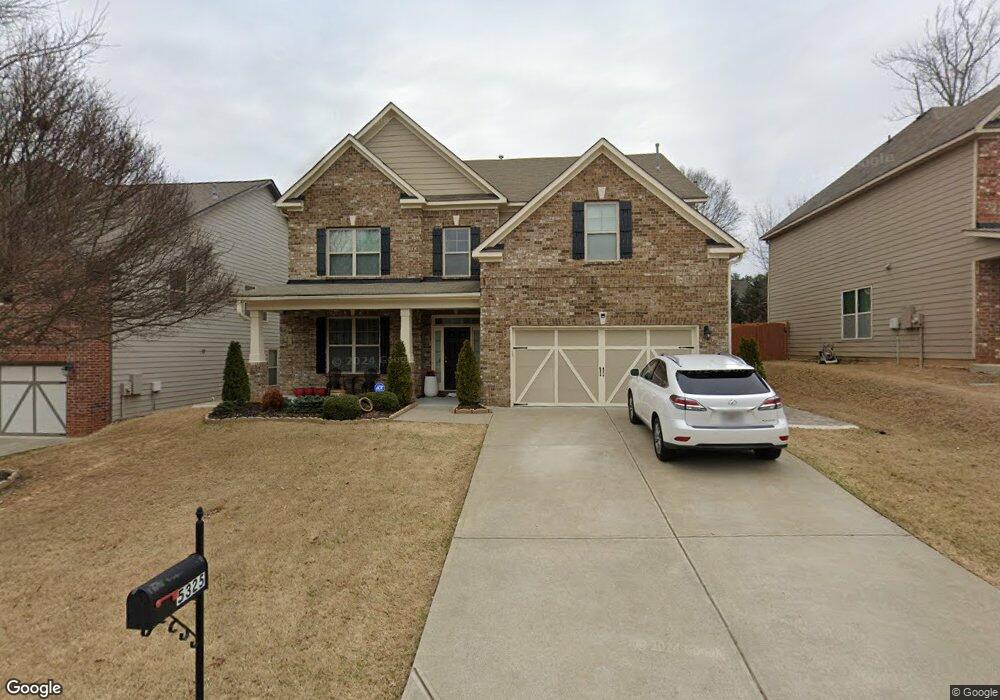
5325 Corinth Ct Cumming, GA 30040
Estimated Value: $688,306 - $717,000
4
Beds
3
Baths
3,456
Sq Ft
$203/Sq Ft
Est. Value
About This Home
This home is located at 5325 Corinth Ct, Cumming, GA 30040 and is currently estimated at $702,327, approximately $203 per square foot. 5325 Corinth Ct is a home with nearby schools including Brandywine Elementary School, DeSana Middle School, and Denmark High School.
Ownership History
Date
Name
Owned For
Owner Type
Purchase Details
Closed on
Dec 29, 2017
Sold by
Kazimova Ruslan
Bought by
Kazimova Tamina
Current Estimated Value
Home Financials for this Owner
Home Financials are based on the most recent Mortgage that was taken out on this home.
Original Mortgage
$202,000
Outstanding Balance
$170,289
Interest Rate
3.9%
Mortgage Type
New Conventional
Estimated Equity
$532,038
Purchase Details
Closed on
Mar 2, 2012
Sold by
Wilson Parker Homes Of Wal
Bought by
Kazimova Tamina and Kazimova Ruslan
Home Financials for this Owner
Home Financials are based on the most recent Mortgage that was taken out on this home.
Original Mortgage
$216,508
Interest Rate
3.75%
Mortgage Type
FHA
Purchase Details
Closed on
Dec 9, 2011
Sold by
Wallace Run Investments Ll
Bought by
Spring Financial Llc
Create a Home Valuation Report for This Property
The Home Valuation Report is an in-depth analysis detailing your home's value as well as a comparison with similar homes in the area
Home Values in the Area
Average Home Value in this Area
Purchase History
| Date | Buyer | Sale Price | Title Company |
|---|---|---|---|
| Kazimova Tamina | -- | -- | |
| Kazimova Tamina | $222,140 | -- | |
| Wilson Parker Homes Of Wallac | -- | -- | |
| Spring Financial Llc | $46,128 | -- |
Source: Public Records
Mortgage History
| Date | Status | Borrower | Loan Amount |
|---|---|---|---|
| Open | Kazimova Tamina | $202,000 | |
| Previous Owner | Wilson Parker Homes Of Wallac | $216,508 |
Source: Public Records
Tax History Compared to Growth
Tax History
| Year | Tax Paid | Tax Assessment Tax Assessment Total Assessment is a certain percentage of the fair market value that is determined by local assessors to be the total taxable value of land and additions on the property. | Land | Improvement |
|---|---|---|---|---|
| 2025 | $4,716 | $269,612 | $74,000 | $195,612 |
| 2024 | $4,716 | $241,288 | $68,000 | $173,288 |
| 2023 | $4,257 | $233,752 | $60,000 | $173,752 |
| 2022 | $4,223 | $161,288 | $44,800 | $116,488 |
| 2021 | $3,859 | $161,288 | $44,800 | $116,488 |
| 2020 | $3,606 | $149,024 | $32,000 | $117,024 |
| 2019 | $3,708 | $153,680 | $32,000 | $121,680 |
| 2018 | $3,389 | $137,296 | $32,000 | $105,296 |
| 2017 | $3,300 | $132,476 | $32,000 | $100,476 |
| 2016 | $3,131 | $124,476 | $24,000 | $100,476 |
| 2015 | $3,041 | $119,916 | $24,000 | $95,916 |
| 2014 | $2,644 | $108,116 | $0 | $0 |
Source: Public Records
Map
Nearby Homes
- 5430 Breckinridge Ln
- 5370 Cedar Glenn Ct
- 5870 Shiloh Woods Dr
- 6130 Shiloh Woods Dr
- 2755 Cezanne Ln
- 5740 Bryson Ln
- 2745 Cezanne Ln
- 5750 Bryson Ln
- 520 Montgomery Ave
- 6030 Rives Dr
- 6005 Aderhold Way
- 2720 Garonne Way
- 6020 Aderhold Way
- 5920 Rives Dr
- 4885 Maristone Landing Way
- 4905 Shiloh Crossing Way
- 4875 Shiloh Crossing Way
- 4735 Shiloh Valley Rd
- 5315 Corinth Ct
- 5335 Corinth Ct
- 0 Corinth Ct Unit 8396736
- 0 Corinth Ct Unit 7303826
- 0 Corinth Ct Unit 7288254
- 5135 Union Hill Rd
- 5305 Corinth Ct
- 5345 Corinth Ct Unit 55
- 5345 Corinth Ct
- 5330 Corinth Ct
- 5275 Breckinridge Ln
- 5340 Corinth Ct
- 5320 Corinth Ct
- 5260 Haven Crest Ln
- 5265 Breckinridge Ln Unit 61
- 5265 Breckinridge Ln
- 5315 Breckinridge Ln
- 5310 Corinth Ct
- 5350 Corinth Ct
- 5250 Haven Crest Ln