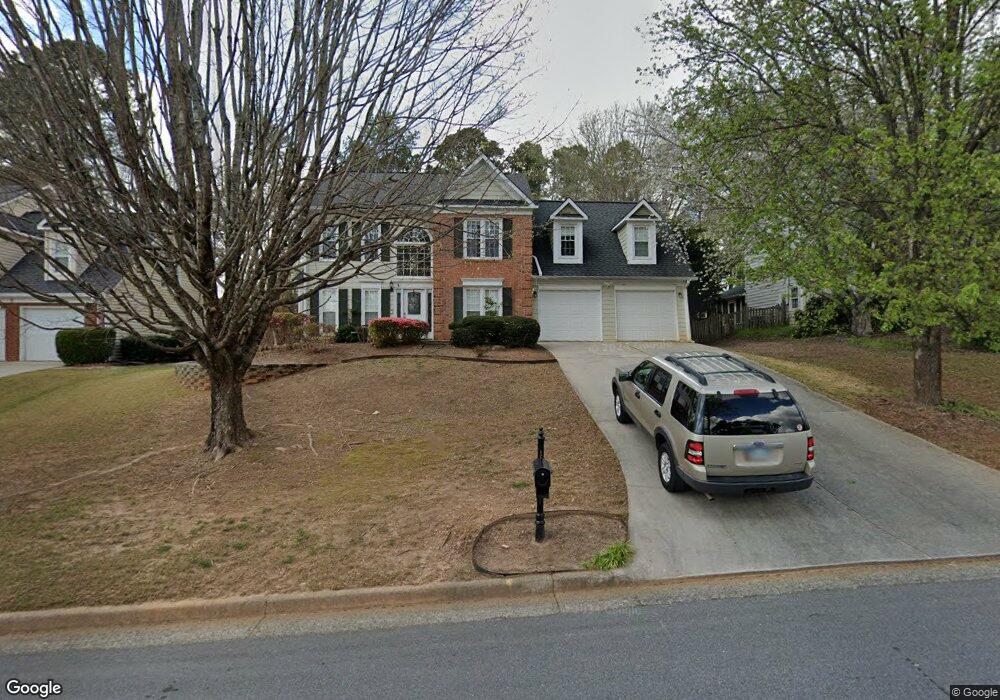
5325 Johns View St Unit 6 Alpharetta, GA 30005
Estimated Value: $566,012 - $614,000
4
Beds
3
Baths
1,820
Sq Ft
$325/Sq Ft
Est. Value
About This Home
This home is located at 5325 Johns View St Unit 6, Alpharetta, GA 30005 and is currently estimated at $592,253, approximately $325 per square foot. 5325 Johns View St Unit 6 is a home located in Fulton County with nearby schools including Abbotts Hill Elementary School, Taylor Road Middle School, and Chattahoochee High School.
Ownership History
Date
Name
Owned For
Owner Type
Purchase Details
Closed on
May 19, 2015
Sold by
Arangode Krishna
Bought by
Tarbell Marjorie
Current Estimated Value
Home Financials for this Owner
Home Financials are based on the most recent Mortgage that was taken out on this home.
Original Mortgage
$273,600
Outstanding Balance
$211,458
Interest Rate
3.77%
Mortgage Type
New Conventional
Estimated Equity
$380,795
Purchase Details
Closed on
Feb 25, 2010
Sold by
Christian Ronald
Bought by
Arangode Krishna
Home Financials for this Owner
Home Financials are based on the most recent Mortgage that was taken out on this home.
Original Mortgage
$244,489
Interest Rate
5.25%
Mortgage Type
FHA
Purchase Details
Closed on
Apr 22, 1997
Sold by
Matteson Keith T and Matteson Ann H
Bought by
Christian Ronald
Home Financials for this Owner
Home Financials are based on the most recent Mortgage that was taken out on this home.
Original Mortgage
$110,000
Interest Rate
8.2%
Mortgage Type
New Conventional
Create a Home Valuation Report for This Property
The Home Valuation Report is an in-depth analysis detailing your home's value as well as a comparison with similar homes in the area
Home Values in the Area
Average Home Value in this Area
Purchase History
| Date | Buyer | Sale Price | Title Company |
|---|---|---|---|
| Tarbell Marjorie | $288,000 | -- | |
| Arangode Krishna | $249,000 | -- | |
| Christian Ronald | $164,000 | -- |
Source: Public Records
Mortgage History
| Date | Status | Borrower | Loan Amount |
|---|---|---|---|
| Open | Tarbell Marjorie | $273,600 | |
| Previous Owner | Arangode Krishna | $244,489 | |
| Previous Owner | Christian Ronald | $110,000 |
Source: Public Records
Tax History Compared to Growth
Tax History
| Year | Tax Paid | Tax Assessment Tax Assessment Total Assessment is a certain percentage of the fair market value that is determined by local assessors to be the total taxable value of land and additions on the property. | Land | Improvement |
|---|---|---|---|---|
| 2025 | $3,216 | $210,720 | $60,800 | $149,920 |
| 2023 | $4,938 | $174,960 | $47,280 | $127,680 |
| 2022 | $3,069 | $149,040 | $43,680 | $105,360 |
| 2021 | $3,027 | $116,280 | $38,120 | $78,160 |
| 2020 | $3,041 | $108,440 | $31,040 | $77,400 |
| 2019 | $367 | $106,520 | $30,520 | $76,000 |
| 2018 | $2,989 | $104,040 | $29,800 | $74,240 |
| 2017 | $3,507 | $115,200 | $37,760 | $77,440 |
| 2016 | $3,864 | $115,200 | $37,760 | $77,440 |
| 2015 | $3,274 | $96,520 | $31,640 | $64,880 |
| 2014 | -- | $78,000 | $25,560 | $52,440 |
Source: Public Records
Map
Nearby Homes
- 335 Dunhill Way Ct
- 1660 Gladewood Dr
- 5610 N Hillbrooke Trace
- 11615 Windbrooke Way
- 5575 Ashwind Trace
- 130 Wyndlam Ct
- 11619 Davenport Ln
- 11686 Davenport Ln
- 775 Ellsborough Ct
- 11260 Donnington Dr
- 6365 Murets Rd
- 5200 Cresslyn Ridge
- 11420 Crossington Rd
- 5785 Oxborough Way Unit 1
- 11150 Highfield Chase Dr
- 1895 Oak Tree Hollow
- 5680 Abbotts Bridge Rd
- 5325 Johns View St
- 5315 Johns View St Unit 6
- 5335 Johns View St
- 5305 Johns View St Unit 6
- 0 Johns View St
- 5335 Hillgate Crossing
- 5345 Johns View St Unit 6
- 5325 Hillgate Crossing
- 5345 Hillgate Crossing Unit 6
- 5355 Hillgate Crossing Unit 6
- 5295 Johns View St Unit 6
- 5380 Johns View St
- 5370 Johns View St Unit 6
- 5360 Johns View St Unit 6
- 405 Johns View Ct Unit 6
- 5390 Johns View St Unit 6
- 5285 Johns View St Unit 6
- 5365 Hillgate Crossing
- 5315 Hillgate Crossing Unit 6
- 415 Johns View Ct