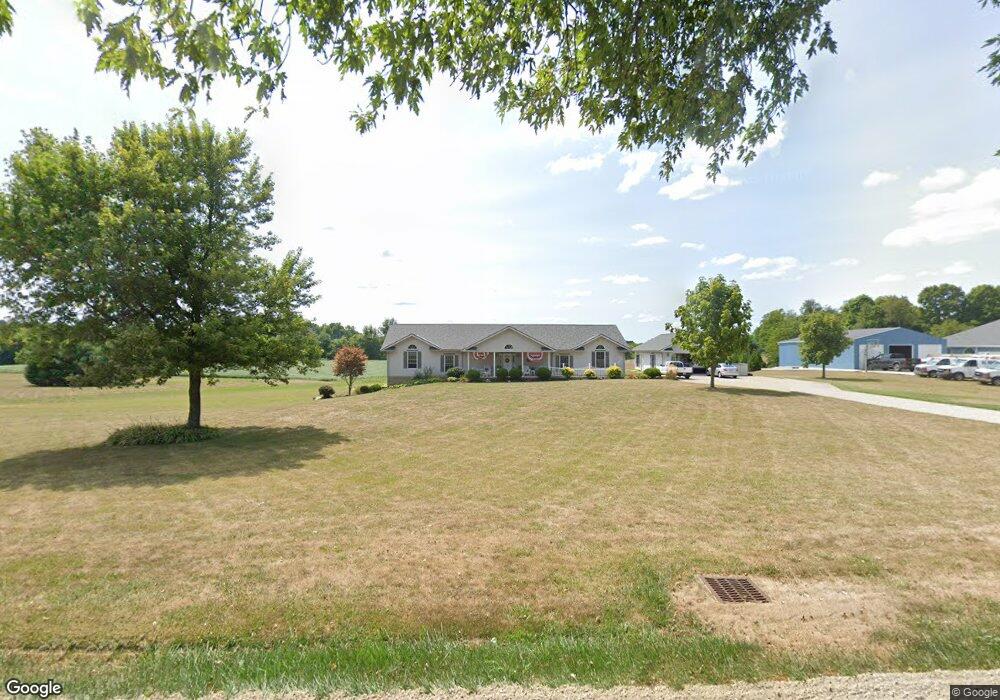
5325 Westfall Rd SW Lancaster, OH 43130
Estimated Value: $381,000 - $643,260
3
Beds
4
Baths
2,688
Sq Ft
$193/Sq Ft
Est. Value
About This Home
This home is located at 5325 Westfall Rd SW, Lancaster, OH 43130 and is currently estimated at $517,753, approximately $192 per square foot. 5325 Westfall Rd SW is a home located in Fairfield County.
Ownership History
Date
Name
Owned For
Owner Type
Purchase Details
Closed on
Nov 1, 2002
Sold by
Herold Scott E
Bought by
Borland Michael A and Borland Teresa A
Current Estimated Value
Home Financials for this Owner
Home Financials are based on the most recent Mortgage that was taken out on this home.
Original Mortgage
$49,500
Interest Rate
6.18%
Mortgage Type
New Conventional
Purchase Details
Closed on
Nov 27, 2001
Sold by
Trst Margaret Rogers
Bought by
Herold Scott E and Herold Tammy A
Home Financials for this Owner
Home Financials are based on the most recent Mortgage that was taken out on this home.
Original Mortgage
$43,506
Interest Rate
6.62%
Mortgage Type
New Conventional
Purchase Details
Closed on
Aug 20, 2001
Sold by
Trst Charles C Spires
Bought by
Cochenour Russell L
Home Financials for this Owner
Home Financials are based on the most recent Mortgage that was taken out on this home.
Original Mortgage
$100,000
Interest Rate
7.23%
Mortgage Type
New Conventional
Create a Home Valuation Report for This Property
The Home Valuation Report is an in-depth analysis detailing your home's value as well as a comparison with similar homes in the area
Home Values in the Area
Average Home Value in this Area
Purchase History
| Date | Buyer | Sale Price | Title Company |
|---|---|---|---|
| Borland Michael A | $55,000 | -- | |
| Herold Scott E | $47,500 | -- | |
| Cochenour Russell L | $64,560 | -- |
Source: Public Records
Mortgage History
| Date | Status | Borrower | Loan Amount |
|---|---|---|---|
| Closed | Borland Michael A | $49,500 | |
| Previous Owner | Herold Scott E | $43,506 | |
| Previous Owner | Cochenour Russell L | $100,000 |
Source: Public Records
Tax History Compared to Growth
Tax History
| Year | Tax Paid | Tax Assessment Tax Assessment Total Assessment is a certain percentage of the fair market value that is determined by local assessors to be the total taxable value of land and additions on the property. | Land | Improvement |
|---|---|---|---|---|
| 2024 | $14,350 | $155,130 | $33,300 | $121,830 |
| 2023 | $5,827 | $155,130 | $33,300 | $121,830 |
| 2022 | $5,905 | $155,130 | $33,300 | $121,830 |
| 2021 | $5,059 | $123,260 | $30,270 | $92,990 |
| 2020 | $4,748 | $123,260 | $30,270 | $92,990 |
| 2019 | $4,410 | $123,260 | $30,270 | $92,990 |
| 2018 | $3,825 | $100,060 | $28,760 | $71,300 |
| 2017 | $3,827 | $101,000 | $24,210 | $76,790 |
| 2016 | $3,730 | $101,000 | $24,210 | $76,790 |
| 2015 | $3,487 | $97,780 | $24,210 | $73,570 |
| 2014 | $3,312 | $97,780 | $24,210 | $73,570 |
| 2013 | $3,312 | $97,780 | $24,210 | $73,570 |
Source: Public Records
Map
Nearby Homes
- 5550 Westfall Rd SW
- 5445 S Duncan Rd SW
- 00 Duncan Rd SW
- 681 Mount Zion Rd SW
- 8416 Royalton Rd SW
- 8245 Royalton Rd SW
- 8143 Royalton Rd SW
- 5701 Lancaster-Circleville Rd SW
- 3330 Hamburg Rd SW
- 10 Mount Zion Rd NW
- 4535 Amanda Northern Rd SW
- 8485 Westfall Rd SW
- 5368 Hopewell Church Rd SW
- 2135 Hamburg Rd SW
- 2300 Stonewall Cemetery Rd SW
- 1430 Hamburg Rd SW
- 6008 Hopewell Church Rd SW
- 1270 Mary Francis Ct
- 1232 Mary Francis Ct
- 0 W Fair Ave
- 5345 Westfall Rd SW
- 5275 Westfall Rd SW
- 5350 Westfall Rd SW
- 5390 Westfall Rd SW
- 5390 Westfall Rd SW
- 5132 Duncan Rd SW
- 5260 Westfall Rd SW
- 5450 Westfall Rd SW
- 5435 Westfall Rd SW
- 5255 Westfall Rd SW
- 5216 Duncan Rd SW
- 5481 Westfall Rd SW
- 5189 Duncan Rd SW
- 3410 Spires Rd SW
- 5170 Westfall Rd SW
- 5521 Westfall Rd SW
- 5530 Westfall Rd SW
- 5545 Westfall Rd SW
- 5565 Westfall Rd SW
- 5080 Westfall Rd SW