R
Seller's Agent in 2013
Ray Fetty
Inactive Office
Estimated Value: $99,000 - $135,979
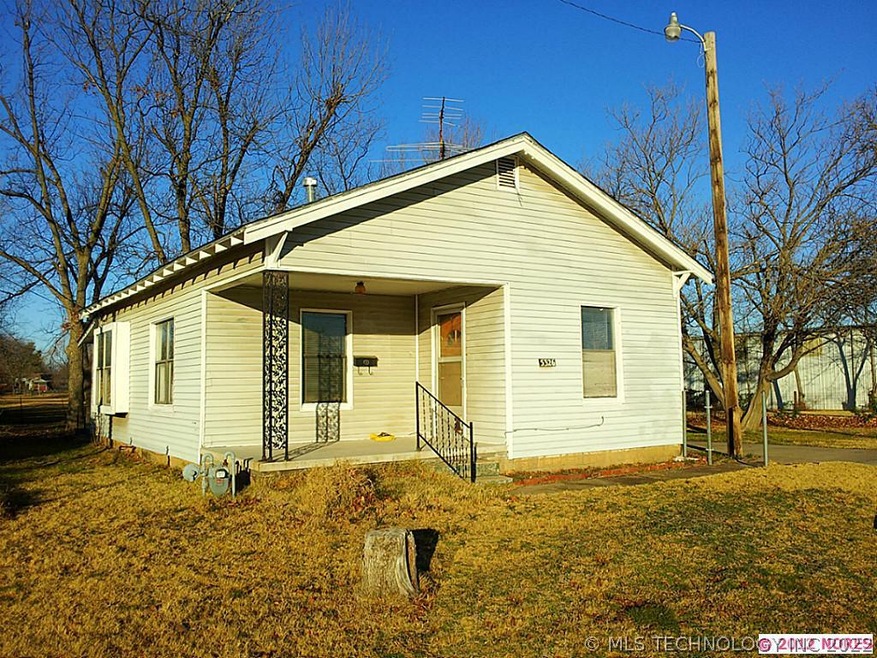
Great price for a 2 bedroom bungalow on 1 1/4 acre lot. Lot goes back to tree line. Clean exterior, vinyl sided. Inside is dated, but was occupied by tenant until 2 months ago.
Last Agent to Sell the Property
Ray Fetty
Inactive Office License #157728 Listed on: 12/14/2012
| Date | Buyer | Sale Price | Title Company |
|---|---|---|---|
| Martinez Sergio Gonzalez | $75,000 | Allegiance Title & Escrow | |
| Julienne Taylor Ii Steven Lee | $31,000 | Tulsa Abstract & Title Co | |
| Matheson Dennis L | -- | -- |
| Date | Status | Borrower | Loan Amount |
|---|---|---|---|
| Open | Martinez Sergio Gonzalez | $63,750 | |
| Previous Owner | Julienne Taylor Ii Steven Lee | $24,800 |
| Date | Event | Price | List to Sale | Price per Sq Ft |
|---|---|---|---|---|
| 03/22/2013 03/22/13 | Sold | $33,000 | -17.3% | $35 / Sq Ft |
| 12/14/2012 12/14/12 | Pending | -- | -- | -- |
| 12/14/2012 12/14/12 | For Sale | $39,900 | -- | $42 / Sq Ft |
| Year | Tax Paid | Tax Assessment Tax Assessment Total Assessment is a certain percentage of the fair market value that is determined by local assessors to be the total taxable value of land and additions on the property. | Land | Improvement |
|---|---|---|---|---|
| 2024 | $1,047 | $8,250 | $1,463 | $6,787 |
| 2023 | $1,047 | $8,250 | $1,463 | $6,787 |
| 2022 | $1,100 | $8,250 | $1,463 | $6,787 |
| 2021 | $318 | $2,410 | $1,034 | $1,376 |
| 2020 | $314 | $2,410 | $1,034 | $1,376 |
| 2019 | $330 | $2,410 | $1,034 | $1,376 |
| 2018 | $331 | $2,410 | $1,034 | $1,376 |
| 2017 | $330 | $3,410 | $1,463 | $1,947 |
| 2016 | $487 | $3,630 | $1,463 | $2,167 |
| 2015 | $488 | $3,630 | $1,463 | $2,167 |
| 2014 | $484 | $3,630 | $1,463 | $2,167 |
R
Seller's Agent in 2013
Ray Fetty
Inactive Office
P
Buyer's Agent in 2013
Peggy Jo McDevitt
Dennis Hall Realtors
(918) 446-4926
4 in this area
7 Total Sales
Source: MLS Technology
MLS Number: 1235979
APN: 99233-92-33-20800
Disclaimer: Certain information contained herein is derived from information provided by parties other than Homes.com. All information provided is deemed reliable, but is not guaranteed to be accurate and should be independently verified.
![]() IDX information is provided exclusively for personal, non-commercial use, and may not be used for any purpose other than to identify prospective properties consumers may be interested in purchasing.
IDX information is provided exclusively for personal, non-commercial use, and may not be used for any purpose other than to identify prospective properties consumers may be interested in purchasing.
Information is deemed reliable but not guaranteed.
