Estimated Value: $2,482,114 - $2,954,000
8
Beds
7
Baths
10,216
Sq Ft
$266/Sq Ft
Est. Value
About This Home
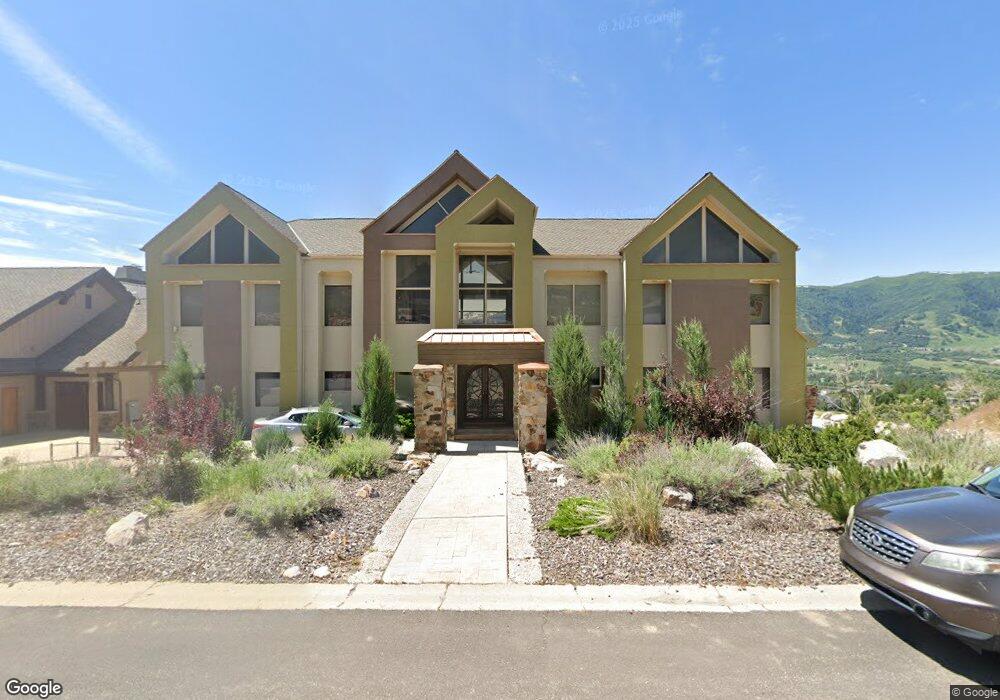
This home is located at 5327 Elkhorn Cir, Eden, UT 84310 and is currently estimated at $2,722,038, approximately $266 per square foot. 5327 Elkhorn Cir is a home located in Weber County with nearby schools including Valley Elementary School, Snowcrest Junior High School, and Weber High School.
Ownership History
Date
Name
Owned For
Owner Type
Purchase Details
Closed on
May 2, 2019
Sold by
Feaster Kenneth V
Bought by
Feaster Kenneth V and Kenneth V Feaster Revocable Tr
Current Estimated Value
Purchase Details
Closed on
Apr 16, 2019
Sold by
Feaster Kenneth V
Bought by
Feaster Kenneth V and Kenneth V Feaster Revocable Tr
Purchase Details
Closed on
Feb 26, 2010
Sold by
Bank Of New York
Bought by
Feaster Kenneth
Purchase Details
Closed on
Nov 26, 2008
Sold by
Laub Anthony
Bought by
Bank Of New York
Purchase Details
Closed on
Mar 30, 2006
Sold by
Laub Diana Lynn
Bought by
Laub Anthony
Create a Home Valuation Report for This Property
The Home Valuation Report is an in-depth analysis detailing your home's value as well as a comparison with similar homes in the area
Home Values in the Area
Average Home Value in this Area
Purchase History
| Date | Buyer | Sale Price | Title Company |
|---|---|---|---|
| Feaster Kenneth V | -- | None Available | |
| Feaster Kenneth V | -- | None Available | |
| Feaster Kenneth | -- | First American Union Park | |
| Bank Of New York | $865,000 | Backman Fptp | |
| Laub Anthony | -- | None Available |
Source: Public Records
Tax History Compared to Growth
Tax History
| Year | Tax Paid | Tax Assessment Tax Assessment Total Assessment is a certain percentage of the fair market value that is determined by local assessors to be the total taxable value of land and additions on the property. | Land | Improvement |
|---|---|---|---|---|
| 2025 | $8,212 | $2,489,352 | $383,722 | $2,105,630 |
| 2024 | $7,088 | $2,275,000 | $343,229 | $1,931,771 |
| 2023 | $5,864 | $1,978,340 | $311,966 | $1,666,374 |
| 2022 | $7,504 | $1,247,307 | $162,662 | $1,084,645 |
| 2021 | $5,619 | $1,503,000 | $164,111 | $1,338,889 |
| 2020 | $4,390 | $1,212,000 | $147,618 | $1,064,382 |
| 2019 | $3,818 | $1,082,000 | $114,628 | $967,372 |
| 2018 | $3,512 | $1,200,000 | $114,628 | $1,085,372 |
| 2017 | $3,377 | $1,093,000 | $77,001 | $1,015,999 |
| 2016 | $3,378 | $619,987 | $42,434 | $577,553 |
| 2015 | $2,636 | $459,250 | $31,313 | $427,937 |
| 2014 | $2,147 | $487,080 | $34,110 | $452,970 |
Source: Public Records
Map
Nearby Homes
- 5357 E Purple Sage Dr
- 5409 E Purple Sage Dr Unit 10
- 5179 E 3900 N Unit 2
- 3643 N Huntsman Path Unit C301
- 3631 N Huntsman Pth Unit C106
- 3631 N Huntsman Path Unit 102
- 3887 Sunset Cir Unit 59
- 3577 N Elkridge Trail
- 3545 N Elkridge Trail Unit 48
- 5491 E Alpen Glow St Unit 68
- 5563 E Alpen Glow St Unit 55
- 5511 E Alpen Glow St Unit 65
- 3911 N Zermatt St
- 3840 N 4975 E Unit A104
- 3840 N 4975 E Unit A205
- 5448 Wapiti Cir Unit 38
- 5652 E Porcupine Ridge Dr
- 4133 N Wolf Ridge Cir Unit 10
- 3880 N 4975 E Unit C207
- 3518 Moosehollow Dr
- 5327 Elkhorn Cir
- 5327 E 3850 N
- 5309 E 3850 N
- 5345 Elkhorn Cir Unit 41
- 5345 Elkhorn Cir
- 5345 E 3850 N
- 5332 Elkhorn Cir
- 5332 Elkhorn Cir
- 5332 Elk Horn Cir
- 5332 Elkhorn Cir Unit 32
- 5332 E 3850 N
- 5332 E 3850 N Unit 32
- 5314 E 3850 N
- 5314 Elkhorn Cir
- 5314 Elkhorn Cir
- 5361 E 3850 N
- 5354 E 3850 N
- 5293 Elkhorn Cir
- 5293 Elkhorn Cir
- 5293 Elkhorn Cir