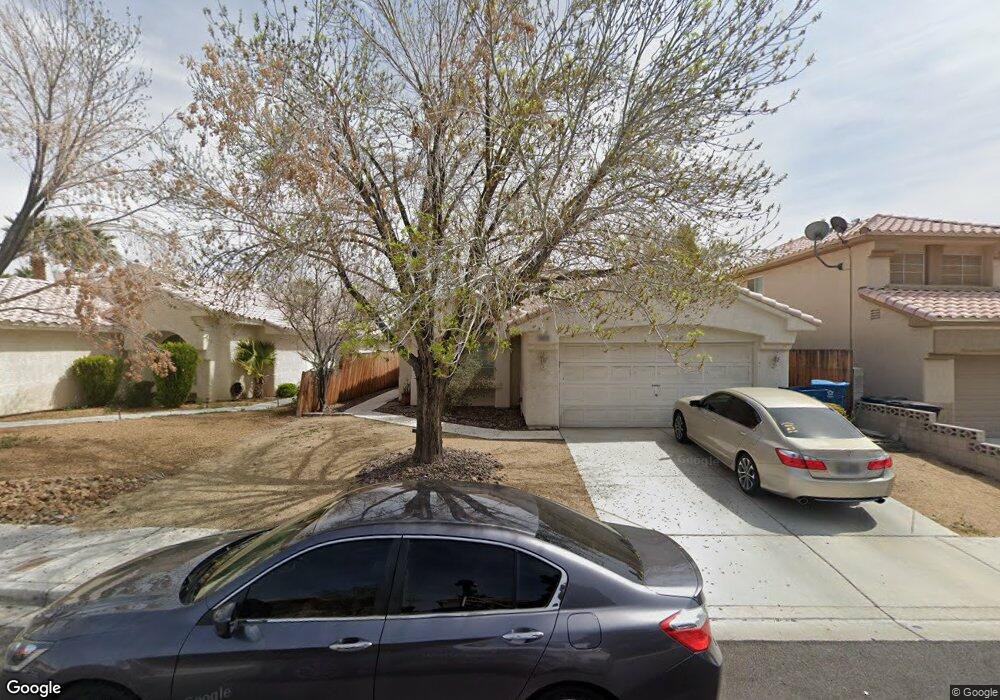
5328 Standing Rock Place Las Vegas, NV 89130
Estimated Value: $373,263 - $404,000
3
Beds
2
Baths
1,272
Sq Ft
$303/Sq Ft
Est. Value
About This Home
This home is located at 5328 Standing Rock Place, Las Vegas, NV 89130 and is currently estimated at $385,566, approximately $303 per square foot. 5328 Standing Rock Place is a home located in Clark County with nearby schools including Ernest May Elementary School, Theron L Swainston Middle School, and Shadow Ridge High School.
Ownership History
Date
Name
Owned For
Owner Type
Purchase Details
Closed on
Dec 14, 2011
Sold by
Pietrowski Michael J
Bought by
Kwok Pui Shan
Current Estimated Value
Purchase Details
Closed on
May 5, 2008
Sold by
Pietrowski Michael
Bought by
Pietrowski Michael J and The Michael J Pietrowski Trust
Purchase Details
Closed on
Feb 3, 2005
Sold by
Culbert Carol L More
Bought by
Pietrowski Michael
Home Financials for this Owner
Home Financials are based on the most recent Mortgage that was taken out on this home.
Original Mortgage
$190,000
Interest Rate
5.73%
Mortgage Type
Unknown
Purchase Details
Closed on
Nov 17, 1994
Sold by
Culbert Robert
Bought by
More Culbert Carol L
Home Financials for this Owner
Home Financials are based on the most recent Mortgage that was taken out on this home.
Original Mortgage
$100,465
Interest Rate
8.91%
Mortgage Type
FHA
Create a Home Valuation Report for This Property
The Home Valuation Report is an in-depth analysis detailing your home's value as well as a comparison with similar homes in the area
Home Values in the Area
Average Home Value in this Area
Purchase History
| Date | Buyer | Sale Price | Title Company |
|---|---|---|---|
| Kwok Pui Shan | $71,000 | Ticor Title Las Vegas | |
| Pietrowski Michael J | -- | None Available | |
| Pietrowski Michael | $237,500 | First Amer Title Co Of Nv | |
| More Culbert Carol L | -- | Nevada Title Company | |
| Culbert Carol L More | $103,000 | Nevada Title Company |
Source: Public Records
Mortgage History
| Date | Status | Borrower | Loan Amount |
|---|---|---|---|
| Previous Owner | Pietrowski Michael | $190,000 | |
| Previous Owner | Culbert Carol L More | $100,465 |
Source: Public Records
Tax History Compared to Growth
Tax History
| Year | Tax Paid | Tax Assessment Tax Assessment Total Assessment is a certain percentage of the fair market value that is determined by local assessors to be the total taxable value of land and additions on the property. | Land | Improvement |
|---|---|---|---|---|
| 2025 | $1,677 | $84,311 | $35,000 | $49,311 |
| 2024 | $1,553 | $84,311 | $35,000 | $49,311 |
| 2023 | $1,553 | $76,651 | $29,750 | $46,901 |
| 2022 | $1,438 | $68,992 | $25,900 | $43,092 |
| 2021 | $1,332 | $64,842 | $23,800 | $41,042 |
| 2020 | $1,234 | $61,796 | $21,000 | $40,796 |
| 2019 | $1,157 | $60,648 | $20,300 | $40,348 |
| 2018 | $1,104 | $52,332 | $13,300 | $39,032 |
| 2017 | $1,736 | $52,958 | $13,300 | $39,658 |
| 2016 | $1,034 | $47,553 | $10,500 | $37,053 |
| 2015 | $1,031 | $36,174 | $7,000 | $29,174 |
| 2014 | $999 | $31,478 | $7,000 | $24,478 |
Source: Public Records
Map
Nearby Homes
- 5409 Flora Spray St
- 6904 Indian Chief Dr Unit 201
- 6705 Squaw Mountain Dr Unit 102
- 6701 Squaw Mountain Dr Unit 201
- 6808 Indian Chief Dr Unit 204
- 5512 Goldbrush St
- 5116 Jordan Frey St Unit 201
- 6704 Indian Chief Dr Unit 101
- 28460 U S Route 95
- 5152 Forest Oaks Dr
- 5144 Forest Oaks Dr
- 7208 Painted Shadows Way
- 6513 Echo Crest Ave
- 6613 Sand Bench Ave
- 7268 Drifting River Ct
- 6540 W Hammer Ln
- 7250 Diamond Canyon Ln Unit 204
- 5634 Bishop Flowers St
- 5041 Portraits Place
- 5024 Saint Annes Dr
- 5332 Standing Rock Place
- 5324 Standing Rock Place
- 5320 Standing Rock Place
- 5336 Standing Rock Place
- 5336 Standing Rock Place Unit na
- 5325 White Coyote Place
- 5321 White Coyote Place
- 5329 White Coyote Place
- 5340 Standing Rock Place
- 5317 White Coyote Place
- 5316 Standing Rock Place
- 5329 Standing Rock Place
- 5333 White Coyote Place
- 5325 Standing Rock Place
- 5333 Standing Rock Place
- 5313 White Coyote Place
- 5337 Standing Rock Place
- 5337 Standing Rock Place Unit None
- 5321 Standing Rock Place
- 5312 Standing Rock Place Unit N