Estimated Value: $190,576
--
Bed
--
Bath
6,000
Sq Ft
$32/Sq Ft
Est. Value
About This Home
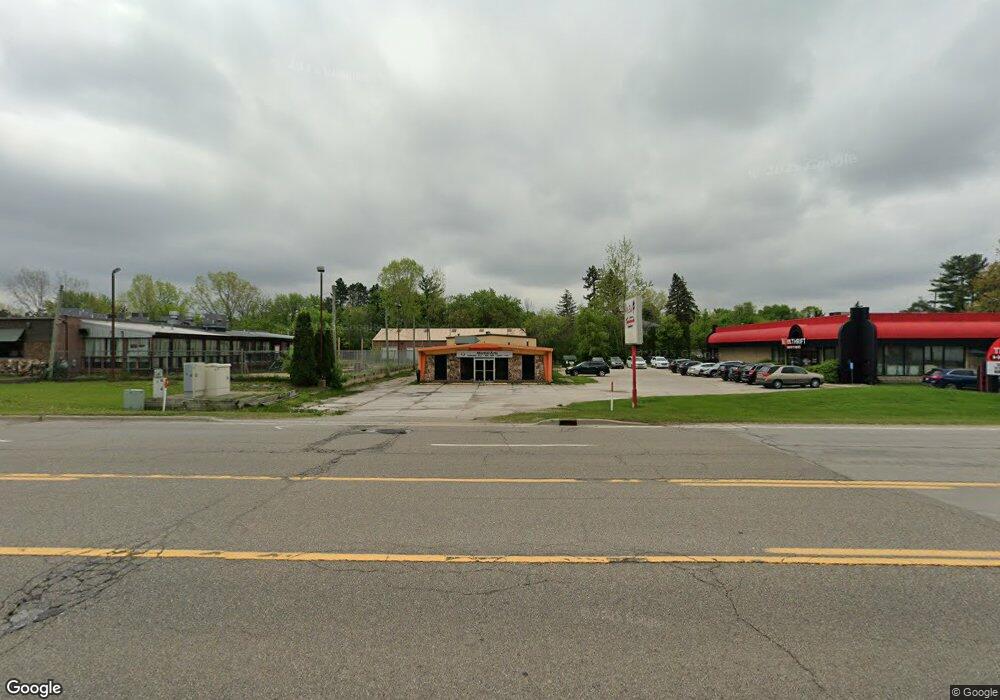
This home is located at 5329 Corunna Rd, Flint, MI 48532 and is currently priced at $190,576, approximately $31 per square foot. 5329 Corunna Rd is a home located in Genesee County with nearby schools including Carman-Ainsworth High School, Genesee STEM Academy, and First Flint Seventh-day Adventist Christian School.
Ownership History
Date
Name
Owned For
Owner Type
Purchase Details
Closed on
Sep 15, 2020
Sold by
Mer Holding Corp
Bought by
Bounenni Walid
Current Estimated Value
Purchase Details
Closed on
May 8, 2008
Sold by
Fauss Mark and Fauss Maria
Bought by
Mer Holding Corp
Purchase Details
Closed on
Nov 29, 2006
Sold by
Adams Bruce J and Adams Michelle D
Bought by
Northpointe Bank
Purchase Details
Closed on
Jun 11, 2003
Sold by
Econo Kool Refrigeration Co
Bought by
Adams Bruce J and Adams Michelle D
Purchase Details
Closed on
Aug 26, 1999
Sold by
Omega Export Inc
Bought by
G A G F Inc
Purchase Details
Closed on
Aug 17, 1999
Sold by
Degayner Ralph
Bought by
Omega Export Inc
Create a Home Valuation Report for This Property
The Home Valuation Report is an in-depth analysis detailing your home's value as well as a comparison with similar homes in the area
Home Values in the Area
Average Home Value in this Area
Purchase History
| Date | Buyer | Sale Price | Title Company |
|---|---|---|---|
| Bounenni Walid | $150,000 | None Listed On Document | |
| Mer Holding Corp | -- | Metropolitan Title Company | |
| Northpointe Bank | $176,895 | None Available | |
| Northpointe Bank | $95,474 | None Available | |
| Adams Bruce J | $175,000 | Sargents Title Company | |
| G A G F Inc | $110,000 | -- | |
| Omega Export Inc | $270,000 | -- |
Source: Public Records
Tax History Compared to Growth
Tax History
| Year | Tax Paid | Tax Assessment Tax Assessment Total Assessment is a certain percentage of the fair market value that is determined by local assessors to be the total taxable value of land and additions on the property. | Land | Improvement |
|---|---|---|---|---|
| 2025 | $10,265 | $185,700 | $0 | $0 |
| 2024 | $7,193 | $177,200 | $0 | $0 |
| 2023 | $7,001 | $173,800 | $0 | $0 |
| 2022 | $5,892 | $170,900 | $0 | $0 |
| 2021 | $2,887 | $167,200 | $0 | $0 |
| 2020 | $4,545 | $166,000 | $0 | $0 |
| 2019 | $4,488 | $163,600 | $0 | $0 |
| 2018 | $6,286 | $133,600 | $0 | $0 |
| 2017 | $6,071 | $133,600 | $0 | $0 |
| 2016 | $6,166 | $122,600 | $0 | $0 |
| 2015 | $6,068 | $112,900 | $0 | $0 |
| 2014 | $4,341 | $103,700 | $0 | $0 |
| 2012 | -- | $103,000 | $47,100 | $55,900 |
Source: Public Records
Map
Nearby Homes
- 0000 Reuben Reuben St
- 5406 Litchfield Dr
- 1460 S Dye Rd
- 5323 Elmsford Dr
- 1417 Grassmere Ave
- 5503 Westchester Dr
- 6007 Corunna Rd
- 1442 Mintola Ave
- 5489 Brobeck St
- 5345 Birchtree Ct
- 2462 Valley Oaks Cir
- 6098 Corunna Rd
- 1455 S Linden Rd
- 2356 S Dye Rd
- 6090 Lancaster Dr
- 4480 Corunna Rd
- 4474 Corunna Rd
- 3.9 Acres W Court St
- 5325 N Dyewood Dr
- 6172 W Court St
- 5337 Corunna Rd
- 5363 Corunna Rd
- 5364 Devon Ct
- 5318 Westchester Dr
- 5304 Westchester Dr
- 5342 Corunna Rd
- 5312 Westchester Dr
- 5298 Westchester Dr
- 5369 Devon Ct
- 5370 Devon Ct
- 5328 Westchester Dr
- 5340 Westchester Dr
- 5379 Devon Ct
- 5380 Devon Ct
- 5334 Westchester Dr
- 2037 Kenwood Dr
- 2019 Kenwood Dr
- 2085 Kenwood Dr
- 2076 Deerfield Dr
- 2025 Kenwood Dr