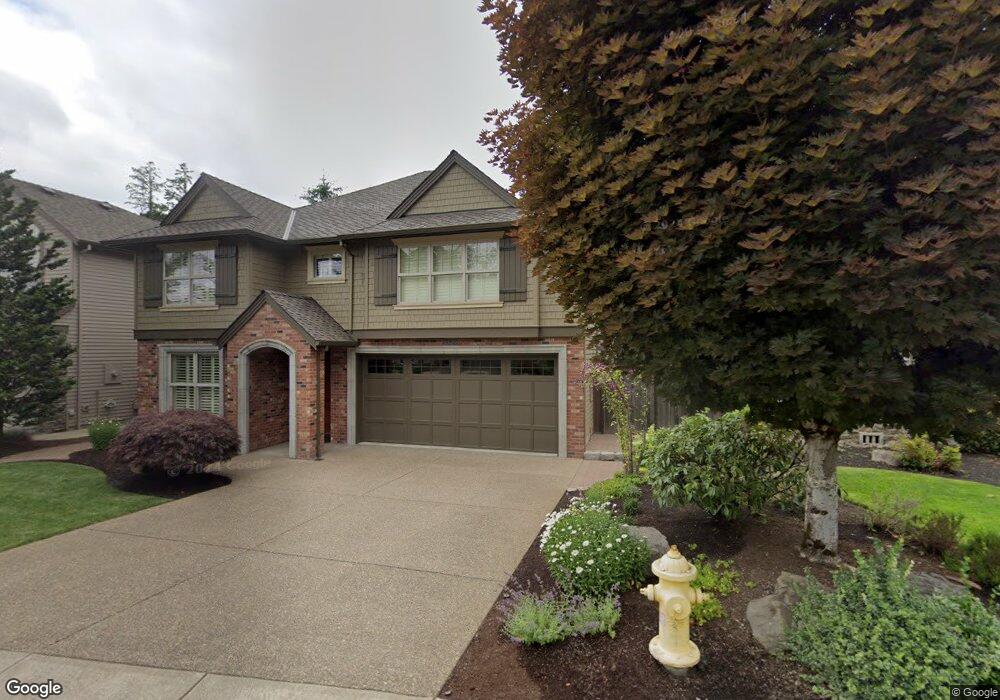
5329 Langford Ln Lake Oswego, OR 97035
Lake Forest NeighborhoodEstimated Value: $1,159,296 - $1,525,000
3
Beds
3
Baths
2,962
Sq Ft
$430/Sq Ft
Est. Value
About This Home
This home is located at 5329 Langford Ln, Lake Oswego, OR 97035 and is currently estimated at $1,272,574, approximately $429 per square foot. 5329 Langford Ln is a home located in Clackamas County with nearby schools including River Grove Elementary School, Lakeridge Middle School, and Lakeridge High School.
Ownership History
Date
Name
Owned For
Owner Type
Purchase Details
Closed on
May 27, 2021
Sold by
Dour Dale P and Dour Eilene L
Bought by
Dour Dale P and Dour Eileen M
Current Estimated Value
Purchase Details
Closed on
Jul 9, 2010
Sold by
Dour Dale P and Dour Eilene L
Bought by
Dour Dale P and Dour Eilene L
Purchase Details
Closed on
Oct 20, 2009
Sold by
Eslinger Builders Inc
Bought by
Dour Dale P and Dour Eilene L
Home Financials for this Owner
Home Financials are based on the most recent Mortgage that was taken out on this home.
Original Mortgage
$219,000
Outstanding Balance
$142,203
Interest Rate
5.05%
Mortgage Type
New Conventional
Estimated Equity
$1,130,371
Purchase Details
Closed on
Mar 16, 2009
Sold by
Fieldstone Development Inc
Bought by
Eslinger Builders Inc
Home Financials for this Owner
Home Financials are based on the most recent Mortgage that was taken out on this home.
Original Mortgage
$1,104,000
Interest Rate
5.19%
Mortgage Type
Commercial
Create a Home Valuation Report for This Property
The Home Valuation Report is an in-depth analysis detailing your home's value as well as a comparison with similar homes in the area
Home Values in the Area
Average Home Value in this Area
Purchase History
| Date | Buyer | Sale Price | Title Company |
|---|---|---|---|
| Dour Dale P | -- | None Available | |
| Dour Eilene M | -- | None Available | |
| Dour Dale P | -- | None Available | |
| Dour Dale P | $719,000 | Fidelity Natl Title Co Of Or | |
| Eslinger Builders Inc | $415,000 | Fidelity Natl Title Of Or |
Source: Public Records
Mortgage History
| Date | Status | Borrower | Loan Amount |
|---|---|---|---|
| Open | Dour Dale P | $219,000 | |
| Previous Owner | Eslinger Builders Inc | $1,104,000 |
Source: Public Records
Tax History Compared to Growth
Tax History
| Year | Tax Paid | Tax Assessment Tax Assessment Total Assessment is a certain percentage of the fair market value that is determined by local assessors to be the total taxable value of land and additions on the property. | Land | Improvement |
|---|---|---|---|---|
| 2025 | $13,913 | $724,461 | -- | -- |
| 2024 | $13,542 | $703,361 | -- | -- |
| 2023 | $13,542 | $682,875 | $0 | $0 |
| 2022 | $12,754 | $662,986 | $0 | $0 |
| 2021 | $11,780 | $643,676 | $0 | $0 |
| 2020 | $11,484 | $624,929 | $0 | $0 |
| 2019 | $11,201 | $606,728 | $0 | $0 |
| 2018 | $10,652 | $589,056 | $0 | $0 |
| 2017 | $10,278 | $571,899 | $0 | $0 |
| 2016 | $9,357 | $555,242 | $0 | $0 |
| 2015 | $9,040 | $539,070 | $0 | $0 |
| 2014 | $8,923 | $523,369 | $0 | $0 |
Source: Public Records
Map
Nearby Homes
- 5363 Greystoke Dr
- 5185 Carman Dr
- 5037 Parkhill St
- 5010 Park Bluff Place
- 15601 Manchester Dr
- 4992 Park Bluff Place
- 5725 Windfield Loop
- 4974 Park Bluff Place
- 5665 Bonita Rd
- 5835 Carman Dr
- 15540 Partridge Dr
- 16061 Waluga Dr
- 4583 Trillium Woods
- 16158 Parker Rd
- 4521 Trillium Woods
- 4520 Trillium Woods
- 16405 Bonaire Ave
- 6087 Carman Dr
- 16508 Bonaire Ave
- 5057 W Sunset Dr
- 5371 Langford Ln
- 5287 Langford Ln
- 5413 Langford Ln
- 5245 Langford Ln Unit Lot 7
- 5245 Langford Ln
- 5322 Langford Ln
- 5364 Langford Ln
- 5455 Langford Ln
- 5406 Langford Ln
- 5355 Carman Dr
- 5422 Bonita Rd
- 5335 Carman Dr
- 5327 Carman Dr
- 5448 Langford Ln
- 5497 Langford Ln
- 5321 Carman Dr
- 5349 Carman Dr Unit LN
- 5349 Carman Dr
- 5366 Bonita Rd
- 5462 Bonita Rd(quiet)