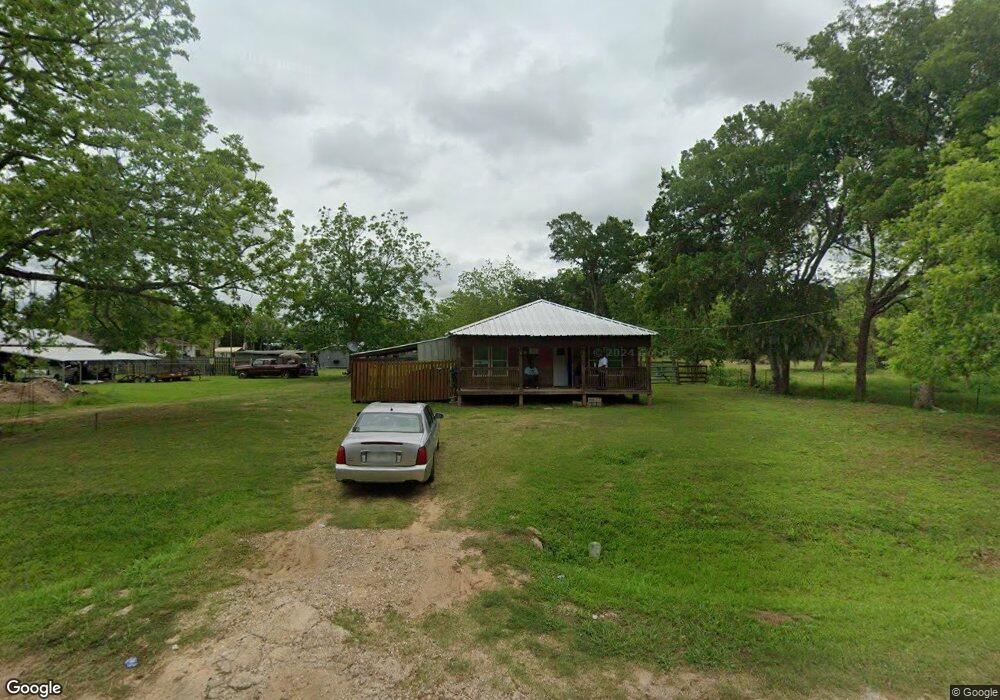
533 5th St Brazoria, TX 77422
Estimated Value: $138,000 - $222,863
--
Bed
--
Bath
1,408
Sq Ft
$133/Sq Ft
Est. Value
About This Home
This home is located at 533 5th St, Brazoria, TX 77422 and is currently estimated at $187,716, approximately $133 per square foot. 533 5th St is a home.
Ownership History
Date
Name
Owned For
Owner Type
Purchase Details
Closed on
Oct 7, 2021
Sold by
Barker Jerry L
Bought by
Foster Erma Lee
Current Estimated Value
Purchase Details
Closed on
Sep 16, 2020
Sold by
King Allen
Bought by
Barker Jerry L
Purchase Details
Closed on
Dec 9, 2019
Sold by
Parker Properties Living Trust
Bought by
King Allen
Purchase Details
Closed on
Dec 7, 2016
Sold by
Evans James and Michelle Evans Shays Lynn
Bought by
Barker Jerry L and Barker Properties Living Trust
Purchase Details
Closed on
Sep 10, 2007
Sold by
Roberts Reuben and Roberts Mamie
Bought by
Columbia Brazoria Independent School Dis and Brazos River Harbor Navigation District
Create a Home Valuation Report for This Property
The Home Valuation Report is an in-depth analysis detailing your home's value as well as a comparison with similar homes in the area
Home Values in the Area
Average Home Value in this Area
Purchase History
| Date | Buyer | Sale Price | Title Company |
|---|---|---|---|
| Foster Erma Lee | -- | None Listed On Document | |
| Barker Jerry L | -- | None Available | |
| King Allen | -- | None Available | |
| Barker Jerry L | -- | Great American Title | |
| Columbia Brazoria Independent School Dis | -- | None Available |
Source: Public Records
Tax History Compared to Growth
Tax History
| Year | Tax Paid | Tax Assessment Tax Assessment Total Assessment is a certain percentage of the fair market value that is determined by local assessors to be the total taxable value of land and additions on the property. | Land | Improvement |
|---|---|---|---|---|
| 2025 | $3,091 | $160,880 | $29,880 | $131,000 |
| 2023 | $3,091 | $206,430 | $38,590 | $167,840 |
| 2022 | $769 | $34,050 | $34,050 | $0 |
| 2021 | $696 | $29,510 | $29,510 | $0 |
| 2020 | $674 | $27,240 | $27,240 | $0 |
| 2019 | $484 | $18,950 | $18,950 | $0 |
| 2018 | $584 | $22,740 | $22,740 | $0 |
| 2017 | $604 | $22,740 | $22,740 | $0 |
| 2016 | $606 | $22,840 | $21,930 | $910 |
| 2014 | -- | $22,630 | $21,930 | $700 |
Source: Public Records
Map
Nearby Homes