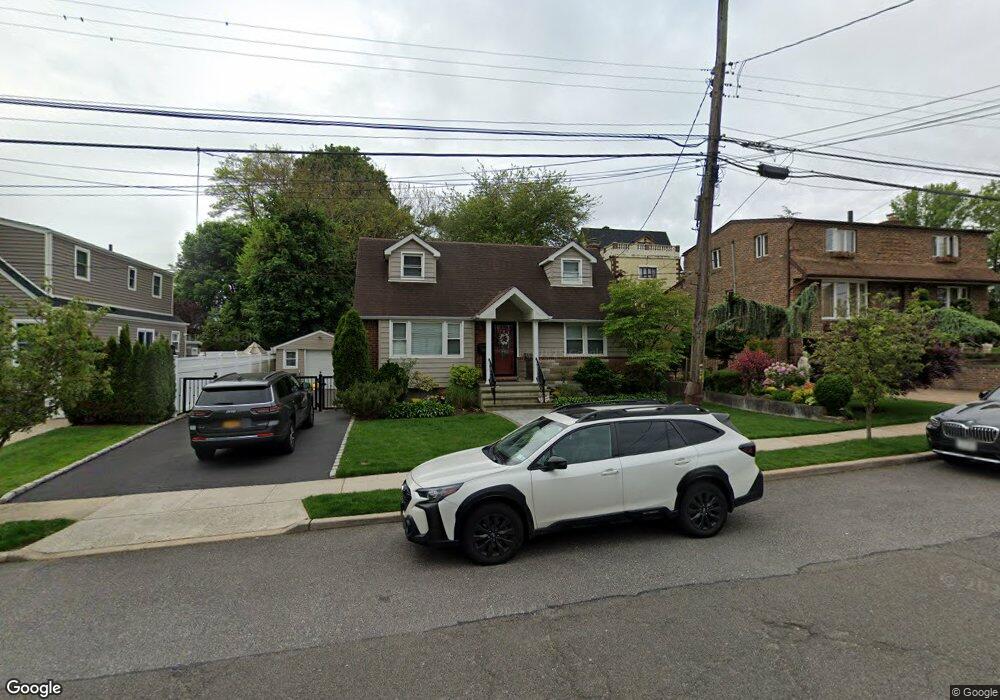
533 8th St West Hempstead, NY 11552
Estimated Value: $737,157 - $853,000
--
Bed
1
Bath
1,187
Sq Ft
$670/Sq Ft
Est. Value
About This Home
This home is located at 533 8th St, West Hempstead, NY 11552 and is currently estimated at $795,079, approximately $669 per square foot. 533 8th St is a home located in Nassau County with nearby schools including The Waldorf School of Garden City.
Ownership History
Date
Name
Owned For
Owner Type
Purchase Details
Closed on
Dec 26, 2024
Sold by
Rodriguez Ciro and Rodriguez Jova
Bought by
Rodriguez Ciro and Rodriguez Jova
Current Estimated Value
Home Financials for this Owner
Home Financials are based on the most recent Mortgage that was taken out on this home.
Original Mortgage
$300,000
Outstanding Balance
$297,273
Interest Rate
6.6%
Mortgage Type
New Conventional
Estimated Equity
$497,806
Purchase Details
Closed on
Dec 31, 2018
Sold by
Martucci David and Martucci Toni
Bought by
Rodriguez Ciro and Rodriguez Jova
Purchase Details
Closed on
Nov 22, 2011
Sold by
Lavin Rosemarie and Anthony J Cangelos Revocable Living Tr
Bought by
Martucci David and Martucci Toni
Home Financials for this Owner
Home Financials are based on the most recent Mortgage that was taken out on this home.
Original Mortgage
$361,580
Interest Rate
4.37%
Mortgage Type
FHA
Purchase Details
Closed on
Apr 15, 2004
Sold by
Cangelosi Anthony
Create a Home Valuation Report for This Property
The Home Valuation Report is an in-depth analysis detailing your home's value as well as a comparison with similar homes in the area
Home Values in the Area
Average Home Value in this Area
Purchase History
| Date | Buyer | Sale Price | Title Company |
|---|---|---|---|
| Rodriguez Ciro | -- | Judicial Title | |
| Rodriguez Ciro | -- | Judicial Title | |
| Rodriguez Ciro | -- | Judicial Title | |
| Rodriguez Ciro | -- | Judicial Title | |
| Rodriguez Ciro | $600,000 | Security Title | |
| Rodriguez Ciro | $600,000 | Security Title | |
| Rodriguez Ciro | $600,000 | Security Title | |
| Martucci David | $371,000 | -- | |
| Martucci David | $371,000 | -- | |
| Martucci David | $371,000 | -- | |
| Martucci David | $371,000 | -- | |
| -- | -- | -- | |
| -- | -- | -- |
Source: Public Records
Mortgage History
| Date | Status | Borrower | Loan Amount |
|---|---|---|---|
| Open | Rodriguez Ciro | $300,000 | |
| Closed | Rodriguez Ciro | $300,000 | |
| Previous Owner | Martucci David | $361,580 |
Source: Public Records
Tax History Compared to Growth
Tax History
| Year | Tax Paid | Tax Assessment Tax Assessment Total Assessment is a certain percentage of the fair market value that is determined by local assessors to be the total taxable value of land and additions on the property. | Land | Improvement |
|---|---|---|---|---|
| 2025 | $9,740 | $443 | $275 | $168 |
| 2024 | $4,216 | $478 | $296 | $182 |
| 2023 | $10,607 | $501 | $310 | $191 |
| 2022 | $10,607 | $539 | $334 | $205 |
| 2021 | $15,053 | $529 | $328 | $201 |
| 2020 | $17,373 | $704 | $449 | $255 |
| 2019 | $3,947 | $704 | $449 | $255 |
| 2018 | $5,436 | $704 | $0 | $0 |
| 2017 | $4,821 | $704 | $449 | $255 |
| 2016 | $8,402 | $704 | $406 | $298 |
| 2015 | $3,346 | $704 | $406 | $298 |
| 2014 | $3,346 | $704 | $406 | $298 |
| 2013 | $3,456 | $778 | $449 | $329 |
Source: Public Records
Map
Nearby Homes
- 124 Kilburn Rd S
- 175 Dorchester Rd
- 644 7th St S
- 89 Osborne Rd
- 234 Nassau Blvd
- 217 Wellington Rd S
- 676 Sobo Ave
- 146 Caroline Ave
- 109 Caroline Ave
- 715 Iris St
- 233 Roxbury Rd S
- 149 Rule St
- 2 Sunset Ln
- 304 Kilburn Rd S
- 594 Fenworth Blvd
- 56 Fendale St
- 301 Concord Ave
- 775 Roosevelt St
- 126 Oakland Ave
- 72 Spruce St
- 83 Kensington Rd S
- 74 Brixton Rd S
- 543 8th St
- 64 Brixton Rd S
- 534 8th St
- 92 Brixton Rd S
- 91 Kensington Rd S
- 523 8th St
- 56 Brixton Rd S
- 545 8th St
- 75 Brixton Rd S
- 517 8th St
- 101 Kensington Rd S
- 102 Brixton Rd S
- 92 Kensington Rd S
- 91 Brixton Rd S
- 55 Brixton Rd S
- 50 Brixton Rd S
- 535 8th St
- 68 Kilburn Rd S