
Landlord's Agent in 2025
Miro Fitkova
Fitkova Realty Group
(617) 921-9952
6 in this area
79 Total Sales
Estimated Value: $655,723 - $750,000
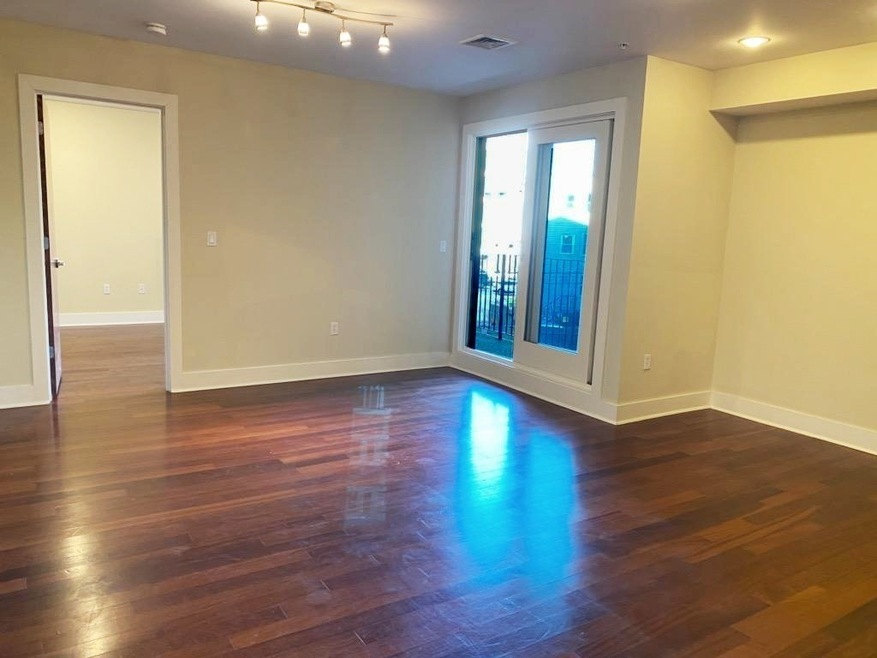
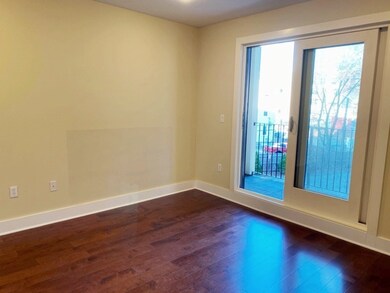
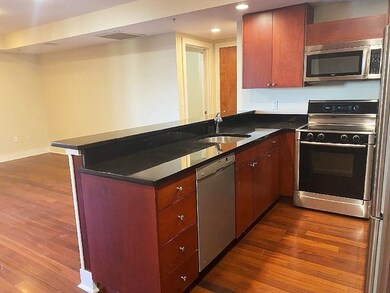
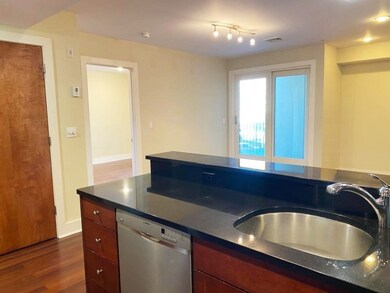
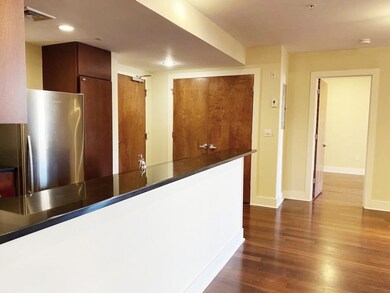
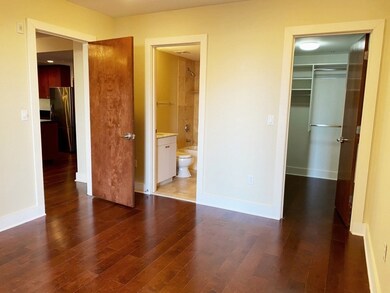
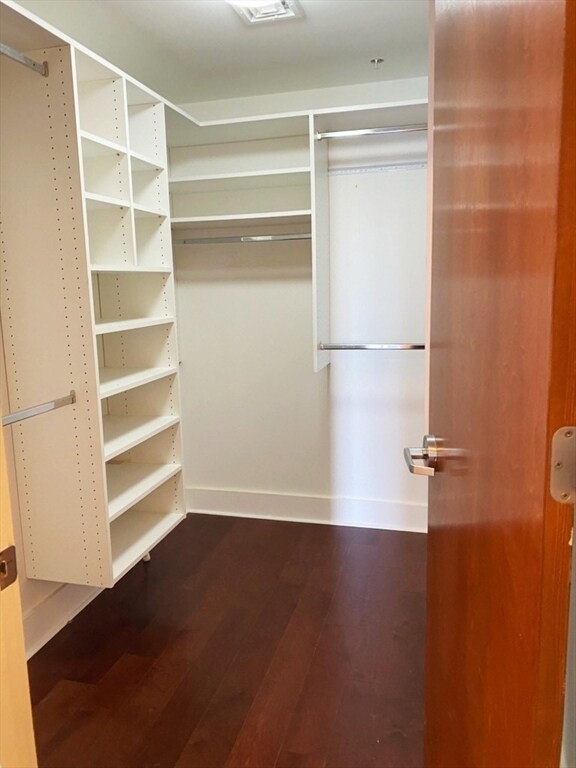
Pristine 1 bed + study/2 full bath in desirable Allston/Brighton neighborhood w/open floorplan. Bright unit full of natural light opens into chef’s kitchen with granite counter tops, designer cherry cabinets & stainless steel appliances. Large living/dining room & cherry hardwood floors throughout. Spacious Master bedroom w/large walk-in closet & en suite bath includes Carrara granite vanity and Travertine tiled shower. Study/Office/Possible second bedroom is across from second full bath. Large private balcony, in unit laundry, Central HVAC, additional storage, 2 car garage spaces w/hydraulic lift in building's lower level. Great location within walking distance to Brighton Center, restaurants, grocery stores, shopping, park & so much more. Quick access bus lines #57, #66, #501, green line T to BU, steps to New Commuter Train stop to Back Bay and South Station. Mins to I-90, Mass Pike, BU, MIT, & Harvard. No smoking, No pets, Available 9/1!
| Date | Buyer | Sale Price | Title Company |
|---|---|---|---|
| Mu Xiaoxiong | $652,000 | None Available | |
| Lu Wenjing | $530,000 | -- | |
| Rumul Christopher L | $358,000 | -- |
| Date | Status | Borrower | Loan Amount |
|---|---|---|---|
| Open | Mu Xiaoxiong | $489,000 | |
| Previous Owner | Rumul Christopher L | $322,200 |
| Date | Event | Price | List to Sale | Price per Sq Ft | Prior Sale |
|---|---|---|---|---|---|
| 06/28/2025 06/28/25 | Rented | $2,950 | 0.0% | -- | |
| 06/20/2025 06/20/25 | Under Contract | -- | -- | -- | |
| 06/10/2025 06/10/25 | For Rent | $2,950 | +9.3% | -- | |
| 01/14/2022 01/14/22 | Rented | -- | -- | -- | |
| 11/26/2021 11/26/21 | For Rent | $2,700 | 0.0% | -- | |
| 11/23/2021 11/23/21 | Sold | $650,000 | +0.8% | $683 / Sq Ft | View Prior Sale |
| 10/13/2021 10/13/21 | Pending | -- | -- | -- | |
| 10/05/2021 10/05/21 | For Sale | $645,000 | +21.7% | $678 / Sq Ft | |
| 03/02/2015 03/02/15 | Sold | $530,000 | 0.0% | $557 / Sq Ft | View Prior Sale |
| 02/16/2015 02/16/15 | Pending | -- | -- | -- | |
| 01/20/2015 01/20/15 | Off Market | $530,000 | -- | -- | |
| 01/14/2015 01/14/15 | For Sale | $515,000 | -- | $541 / Sq Ft |
| Year | Tax Paid | Tax Assessment Tax Assessment Total Assessment is a certain percentage of the fair market value that is determined by local assessors to be the total taxable value of land and additions on the property. | Land | Improvement |
|---|---|---|---|---|
| 2025 | $7,041 | $608,000 | $0 | $608,000 |
| 2024 | $6,399 | $587,100 | $0 | $587,100 |
| 2023 | $6,305 | $587,100 | $0 | $587,100 |
| 2022 | $5,948 | $546,700 | $0 | $546,700 |
| 2021 | $5,833 | $546,700 | $0 | $546,700 |
| 2020 | $5,944 | $562,900 | $0 | $562,900 |
| 2019 | $5,813 | $551,500 | $0 | $551,500 |
| 2018 | $5,403 | $515,600 | $0 | $515,600 |
| 2017 | $5,057 | $477,500 | $0 | $477,500 |
| 2016 | $4,819 | $438,100 | $0 | $438,100 |
| 2015 | $5,159 | $426,000 | $0 | $426,000 |
| 2014 | $4,870 | $387,100 | $0 | $387,100 |
Landlord's Agent in 2025
Miro Fitkova
Fitkova Realty Group
(617) 921-9952
6 in this area
79 Total Sales
M
Buyer's Agent in 2022
Monica Yin
Space Realty
(857) 333-8223
4 Total Sales
Seller's Agent in 2021
Dan Li
Keller Williams Realty
(617) 855-5121
2 in this area
170 Total Sales
Seller's Agent in 2015
Vineburgh DiMella Team
Charlesgate Realty Group, llc
(617) 921-9060
1 in this area
371 Total Sales
N
Buyer's Agent in 2015
Noah Fasten
Coldwell Banker Realty - Brookline
Source: MLS Property Information Network (MLS PIN)
MLS Number: 73388720
APN: ALLS-000000-000021-001294-000006
Disclaimer: Certain information contained herein is derived from information provided by parties other than Homes.com. All information provided is deemed reliable, but is not guaranteed to be accurate and should be independently verified.
![]() The property listing data and information, or the Images, set forth herein were provided to MLS Property Information Network, Inc. from third party sources, including sellers, lessors and public records, and were compiled by MLS Property Information Network, Inc. The property listing data and information, and the Images, are for the personal, non-commercial use of consumers having a good faith interest in purchasing or leasing listed properties of the type displayed to them and may not be used for any purpose other than to identify prospective properties which such consumers may have a good faith interest in purchasing or leasing. MLS Property Information Network, Inc. and its subscribers disclaim any and all representations and warranties as to the accuracy of the property listing data and information, or as to the accuracy of any of the Images, set forth herein.
The property listing data and information, or the Images, set forth herein were provided to MLS Property Information Network, Inc. from third party sources, including sellers, lessors and public records, and were compiled by MLS Property Information Network, Inc. The property listing data and information, and the Images, are for the personal, non-commercial use of consumers having a good faith interest in purchasing or leasing listed properties of the type displayed to them and may not be used for any purpose other than to identify prospective properties which such consumers may have a good faith interest in purchasing or leasing. MLS Property Information Network, Inc. and its subscribers disclaim any and all representations and warranties as to the accuracy of the property listing data and information, or as to the accuracy of any of the Images, set forth herein.
Ask me questions while you tour the home.