
533 Cambridge St Unit 309 Allston, MA 02134
Brighton Neighborhood
2
Beds
2
Baths
1,088
Sq Ft
2009
Built
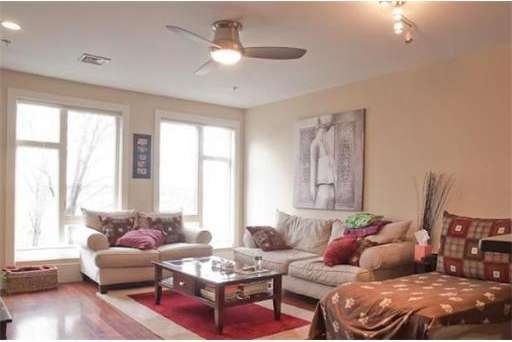
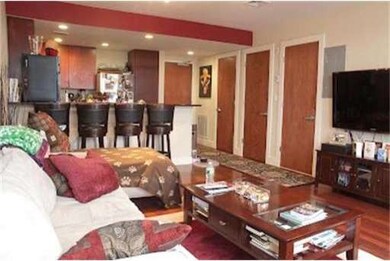
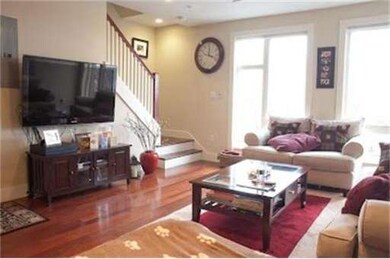
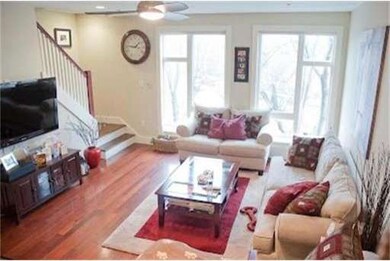
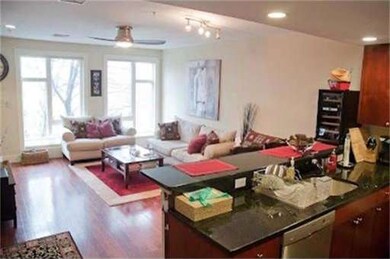
About This Home
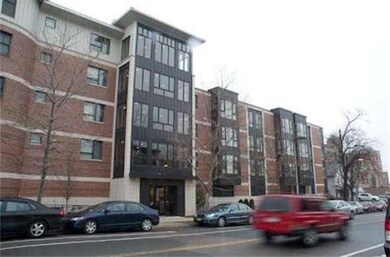
As of May 2012One of a kind duplex penthouse. Roof-Deck, 2 Garage Parking, Extra Storage Lockers, Boston Skyline Views from Terrace! New building ground up completion in 2009 Great Allston/Brighton location walking distance to Brighton Center and great commuter location near cambridge, brookline and storrow drive.
Last Agent to Sell the Property
Northeast Development & Investment, Inc. Listed on: 03/15/2012
Property Details
Home Type
Condominium
Est. Annual Taxes
$9,153
Year Built
2009
Lot Details
0
Listing Details
- Unit Level: 4
- Unit Placement: Top/Penthouse
- Special Features: None
- Property Sub Type: Condos
- Year Built: 2009
Interior Features
- Has Basement: No
- Number of Rooms: 4
- Flooring: Wood
Exterior Features
- Construction: Brick
- Exterior: Brick
- Exterior Unit Features: Deck, Deck - Composite
Garage/Parking
- Garage Parking: Garage Door Opener, Heated, Storage
- Garage Spaces: 2
- Parking Spaces: 2
Utilities
- Cooling Zones: 1
- Heat Zones: 1
- Hot Water: Electric
- Utility Connections: for Electric Range, for Electric Oven, for Electric Dryer
Condo/Co-op/Association
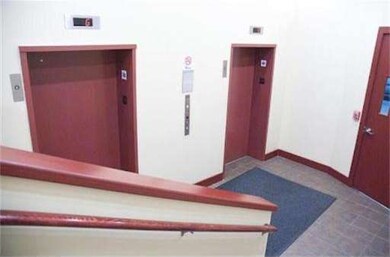
- Association Fee Includes: Water, Sewer, Master Insurance, Security, Elevator, Exterior Maintenance, Road Maintenance, Landscaping, Snow Removal, Extra Storage
- Management: Professional - Off Site
- No Units: 44
- Unit Building: 309
Ownership History
Date
Name
Owned For
Owner Type
Purchase Details
Closed on
Oct 9, 2008
Sold by
Union Rt
Bought by
Albanese Matthew P
Home Financials for this Owner
Home Financials are based on the most recent Mortgage that was taken out on this home.
Original Mortgage
$340,940
Interest Rate
6.43%
Mortgage Type
Purchase Money Mortgage
Similar Homes in the area
Create a Home Valuation Report for This Property
The Home Valuation Report is an in-depth analysis detailing your home's value as well as a comparison with similar homes in the area
Home Values in the Area
Average Home Value in this Area
Purchase History
| Date | Type | Sale Price | Title Company |
|---|---|---|---|
| Deed | $426,175 | -- |
Source: Public Records
Mortgage History
| Date | Status | Loan Amount | Loan Type |
|---|---|---|---|
| Open | $360,000 | Stand Alone Refi Refinance Of Original Loan | |
| Closed | $338,000 | No Value Available | |
| Closed | $340,940 | Purchase Money Mortgage |
Source: Public Records
Property History
| Date | Event | Price | Change | Sq Ft Price |
|---|---|---|---|---|
| 07/25/2025 07/25/25 | Pending | -- | -- | -- |
| 06/05/2025 06/05/25 | For Sale | $829,000 | 0.0% | $762 / Sq Ft |
| 09/01/2023 09/01/23 | Rented | $3,600 | 0.0% | -- |
| 07/07/2023 07/07/23 | Under Contract | -- | -- | -- |
| 06/15/2023 06/15/23 | For Rent | $3,600 | 0.0% | -- |
| 07/04/2022 07/04/22 | Rented | $3,600 | 0.0% | -- |
| 07/01/2022 07/01/22 | Under Contract | -- | -- | -- |
| 05/16/2022 05/16/22 | For Rent | $3,600 | +5.9% | -- |
| 09/11/2021 09/11/21 | Rented | -- | -- | -- |
| 07/28/2021 07/28/21 | Under Contract | -- | -- | -- |
| 06/26/2021 06/26/21 | For Rent | $3,400 | +3.0% | -- |
| 05/30/2018 05/30/18 | Rented | $3,300 | 0.0% | -- |
| 05/03/2018 05/03/18 | Under Contract | -- | -- | -- |
| 04/23/2018 04/23/18 | Off Market | $3,300 | -- | -- |
| 04/10/2018 04/10/18 | For Rent | $3,300 | +3.1% | -- |
| 07/14/2017 07/14/17 | Rented | $3,200 | 0.0% | -- |
| 06/16/2017 06/16/17 | Under Contract | -- | -- | -- |
| 05/31/2017 05/31/17 | Price Changed | $3,200 | -3.0% | $3 / Sq Ft |
| 05/10/2017 05/10/17 | Price Changed | $3,300 | -2.9% | $3 / Sq Ft |
| 03/19/2017 03/19/17 | For Rent | $3,400 | +6.3% | -- |
| 05/15/2016 05/15/16 | Rented | $3,200 | 0.0% | -- |
| 05/05/2016 05/05/16 | For Rent | $3,200 | 0.0% | -- |
| 04/27/2016 04/27/16 | Under Contract | -- | -- | -- |
| 04/14/2016 04/14/16 | For Rent | $3,200 | +6.7% | -- |
| 07/12/2015 07/12/15 | Rented | $3,000 | -6.3% | -- |
| 06/12/2015 06/12/15 | Under Contract | -- | -- | -- |
| 04/22/2015 04/22/15 | For Rent | $3,200 | 0.0% | -- |
| 05/01/2012 05/01/12 | Sold | $456,500 | -3.9% | $420 / Sq Ft |
| 04/05/2012 04/05/12 | Pending | -- | -- | -- |
| 03/15/2012 03/15/12 | For Sale | $475,000 | -- | $437 / Sq Ft |
Source: MLS Property Information Network (MLS PIN)
Tax History Compared to Growth
Tax History
| Year | Tax Paid | Tax Assessment Tax Assessment Total Assessment is a certain percentage of the fair market value that is determined by local assessors to be the total taxable value of land and additions on the property. | Land | Improvement |
|---|---|---|---|---|
| 2025 | $9,153 | $790,400 | $0 | $790,400 |
| 2024 | $7,686 | $705,100 | $0 | $705,100 |
| 2023 | $7,573 | $705,100 | $0 | $705,100 |
| 2022 | $7,237 | $665,200 | $0 | $665,200 |
| 2021 | $7,098 | $665,200 | $0 | $665,200 |
| 2020 | $6,620 | $626,900 | $0 | $626,900 |
| 2019 | $6,479 | $614,700 | $0 | $614,700 |
| 2018 | $6,023 | $574,700 | $0 | $574,700 |
| 2017 | $5,636 | $532,200 | $0 | $532,200 |
| 2016 | $5,371 | $488,300 | $0 | $488,300 |
| 2015 | $6,028 | $497,800 | $0 | $497,800 |
| 2014 | $5,691 | $452,400 | $0 | $452,400 |
Source: Public Records
Agents Affiliated with this Home
-
Ryan Wilson
Seller's Agent in 2025
Ryan Wilson
Keller Williams Realty
(781) 424-6286
1 in this area
666 Total Sales
-
A
Seller's Agent in 2023
Amber Meng
Dreamega International Realty LLC
-
Ziqi Yue
Z
Buyer's Agent in 2023
Ziqi Yue
Space Realty
34 Total Sales
-
Patrick Yuan
P
Seller's Agent in 2022
Patrick Yuan
Dreamega International Realty LLC
41 Total Sales
-
Haoxuan Li
H
Buyer's Agent in 2022
Haoxuan Li
Oak Forest Realty, LLC
(857) 389-4093
1 in this area
6 Total Sales
-
Yifei Wang
Seller's Agent in 2018
Yifei Wang
Dreamega International Realty LLC
(617) 650-8268
31 Total Sales
Map
Source: MLS Property Information Network (MLS PIN)
MLS Number: 71352133
APN: ALLS-000000-000021-001294-000066
Disclaimer: Certain information contained herein is derived from information provided by parties other than Homes.com. All information provided is deemed reliable, but is not guaranteed to be accurate and should be independently verified.
![]() The property listing data and information, or the Images, set forth herein were provided to MLS Property Information Network, Inc. from third party sources, including sellers, lessors and public records, and were compiled by MLS Property Information Network, Inc. The property listing data and information, and the Images, are for the personal, non-commercial use of consumers having a good faith interest in purchasing or leasing listed properties of the type displayed to them and may not be used for any purpose other than to identify prospective properties which such consumers may have a good faith interest in purchasing or leasing. MLS Property Information Network, Inc. and its subscribers disclaim any and all representations and warranties as to the accuracy of the property listing data and information, or as to the accuracy of any of the Images, set forth herein.
The property listing data and information, or the Images, set forth herein were provided to MLS Property Information Network, Inc. from third party sources, including sellers, lessors and public records, and were compiled by MLS Property Information Network, Inc. The property listing data and information, and the Images, are for the personal, non-commercial use of consumers having a good faith interest in purchasing or leasing listed properties of the type displayed to them and may not be used for any purpose other than to identify prospective properties which such consumers may have a good faith interest in purchasing or leasing. MLS Property Information Network, Inc. and its subscribers disclaim any and all representations and warranties as to the accuracy of the property listing data and information, or as to the accuracy of any of the Images, set forth herein.
Nearby Homes
- 23 Gordon St
- 32 High Rock Way Unit 1
- 15 N Beacon St Unit 1012
- 15 N Beacon St Unit L01
- 15 N Beacon St Unit 328
- 581 Cambridge St
- 244 Brighton Ave Unit 405
- 602-604 Cambridge St
- 88 Gordon St Unit 305
- 130 Glenville Ave
- 1408 Commonwealth Ave Unit 20
- 152-156 Kelton St
- 50 Hichborn St Unit 204
- 50 Hichborn St Unit 408
- 1404 Commonwealth Ave Unit 4-8
- 161 Allston St
- 147 Kelton St Unit 609
- 147 Kelton St Unit 312
- 21 Park Vale Ave Unit 2
- 30 Glenville Ave Unit 1