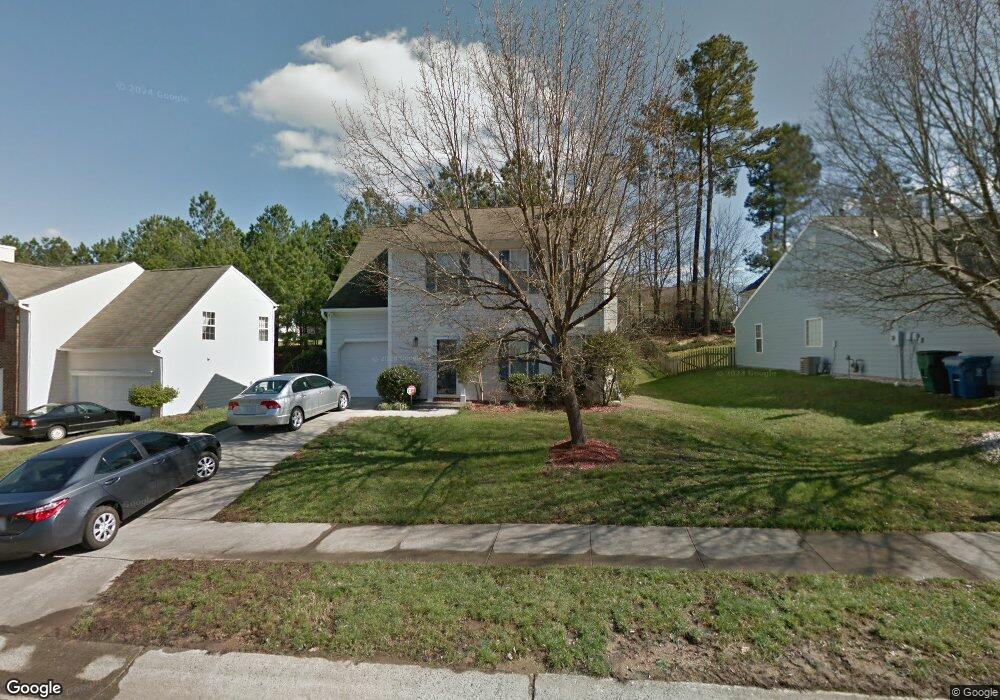
533 Crossview Ln Durham, NC 27703
Eastern Durham NeighborhoodEstimated Value: $360,952 - $391,000
4
Beds
3
Baths
1,704
Sq Ft
$224/Sq Ft
Est. Value
About This Home
This home is located at 533 Crossview Ln, Durham, NC 27703 and is currently estimated at $381,738, approximately $224 per square foot. 533 Crossview Ln is a home located in Durham County with nearby schools including Oak Grove Elementary, John W Neal Middle School, and Southern School of Energy & Sustainability.
Ownership History
Date
Name
Owned For
Owner Type
Purchase Details
Closed on
Jul 14, 2015
Sold by
Asfaw Yohannes G
Bought by
Tiku Nigist M
Current Estimated Value
Purchase Details
Closed on
Sep 29, 2000
Sold by
D R Horton Inc Torrey
Bought by
Asfaw Yohannes G and Tiku Nigist M
Home Financials for this Owner
Home Financials are based on the most recent Mortgage that was taken out on this home.
Original Mortgage
$136,650
Interest Rate
7.92%
Create a Home Valuation Report for This Property
The Home Valuation Report is an in-depth analysis detailing your home's value as well as a comparison with similar homes in the area
Home Values in the Area
Average Home Value in this Area
Purchase History
| Date | Buyer | Sale Price | Title Company |
|---|---|---|---|
| Tiku Nigist M | -- | -- | |
| Asfaw Yohannes G | $144,000 | -- |
Source: Public Records
Mortgage History
| Date | Status | Borrower | Loan Amount |
|---|---|---|---|
| Previous Owner | Asfaw Yohannes G | $136,650 |
Source: Public Records
Tax History
| Year | Tax Paid | Tax Assessment Tax Assessment Total Assessment is a certain percentage of the fair market value that is determined by local assessors to be the total taxable value of land and additions on the property. | Land | Improvement |
|---|---|---|---|---|
| 2025 | $3,425 | $345,537 | $60,696 | $284,841 |
| 2024 | $2,802 | $200,898 | $44,325 | $156,573 |
| 2023 | $2,632 | $200,898 | $44,325 | $156,573 |
| 2022 | $2,571 | $200,898 | $44,325 | $156,573 |
| 2021 | $2,559 | $200,898 | $44,325 | $156,573 |
| 2020 | $2,499 | $200,898 | $44,325 | $156,573 |
| 2019 | $2,499 | $200,898 | $44,325 | $156,573 |
| 2018 | $2,092 | $154,253 | $32,505 | $121,748 |
| 2017 | $2,077 | $154,253 | $32,505 | $121,748 |
| 2016 | $2,007 | $154,253 | $32,505 | $121,748 |
| 2015 | $2,184 | $157,779 | $32,180 | $125,599 |
| 2014 | $2,184 | $157,779 | $32,180 | $125,599 |
Source: Public Records
Map
Nearby Homes
- 604 Bellmeade Bay Dr
- 501 Bellmeade Bay Dr
- 411 Bellmeade Bay Dr
- 3908 Holder Rd
- 615 Southshore Pkwy
- 907 Danbury Dr
- 4 Jarvis Ct
- 1315 Pennock Rd
- 210 Stoney Creek Cir
- 601 Crossing Dr
- 1107 High Fox Dr
- 208 Lick Creek Ln
- 1015 Sora Way
- 110 Kindlewood Dr
- 610 Sherron Rd
- 442 Gus Rd
- 517 Keith St
- 102 Harvest Oaks Ln Unit 38
- 2055 Tanners Mill Dr
- 3311 Delmar Dr
- 535 Crossview Ln
- 529 Crossview Ln
- 714 Bellmeade Bay Dr
- 527 Crossview Ln
- 716 Bellmeade Bay Dr
- 712 Bellmeade Bay Dr
- 532 Crossview Ln
- 718 Bellmeade Bay Dr
- 534 Crossview Ln
- 530 Crossview Ln
- 525 Crossview Ln
- 539 Crossview Ln
- 536 Crossview Ln
- 708 Bellmeade Bay Dr
- 528 Crossview Ln
- 720 Bellmeade Bay Dr
- 538 Crossview Ln
- 523 Crossview Ln
- 526 Crossview Ln
- 706 Bellmeade Bay Dr
Your Personal Tour Guide
Ask me questions while you tour the home.