533 Dawn Dr West Columbia, SC 29170
About This Home
MOVE-IN READY
This home is move-in ready. Schedule your tour now or start your application today.
Monthly Recurring Fees:
$25.00 - Septic Maintenance
$10.95 - Utility Management
Maymont Homes is committed to clear and upfront pricing. In addition to the advertised rent, residents may have monthly fees, including a $10.95 utility management fee, a $25.00 wastewater fee for homes on septic systems, and an amenity fee for homes with smart home technology, valet trash, or other community amenities. This does not include utilities or optional fees, including but not limited to pet fees and renter’s insurance.
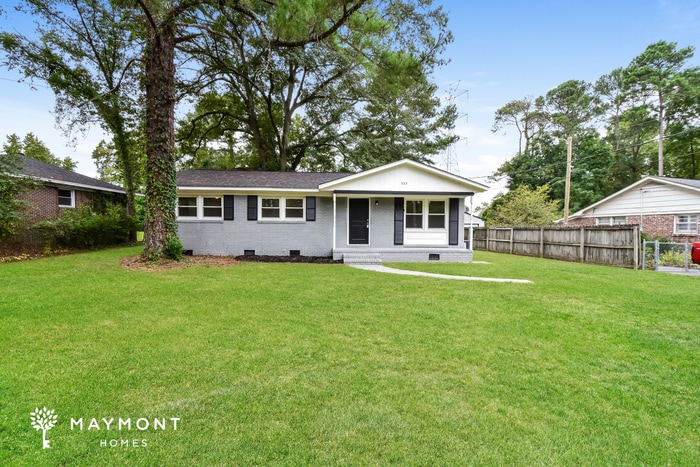
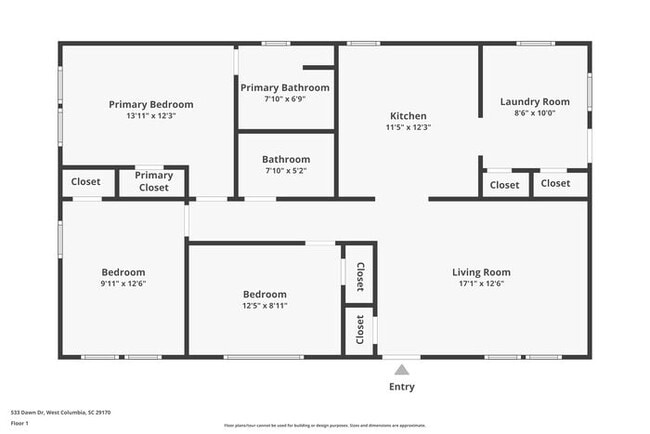
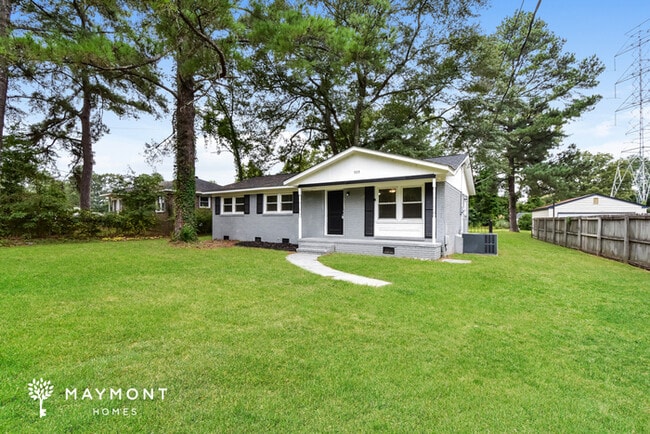
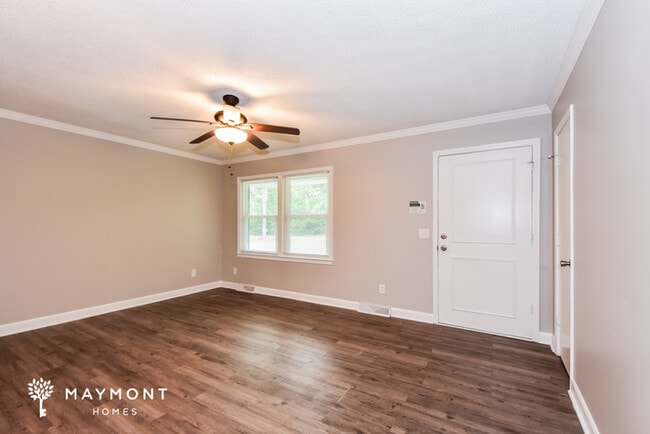
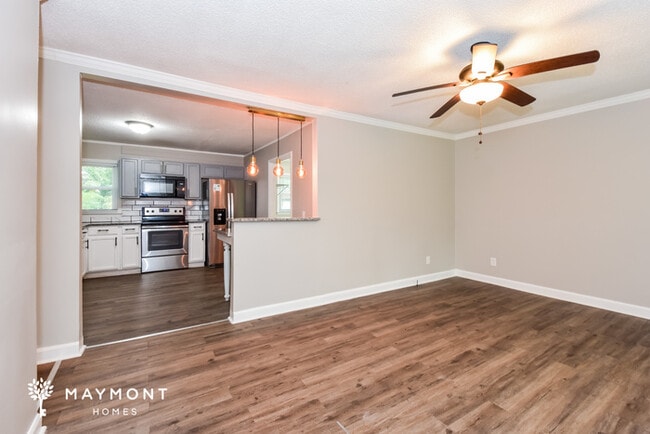
Discover this 3-bedroom, 2-bathroom home with 1,118 sq. ft. at West Columbia, where updates and thoughtful details make everyday living easy. The exterior welcomes you with curb appeal, while the covered front porch provides a relaxing spot to enjoy the tree-lined surroundings. Inside, the open layout starts with a spacious living room featuring LVP flooring, a ceiling fan, and crown molding for a polished touch.
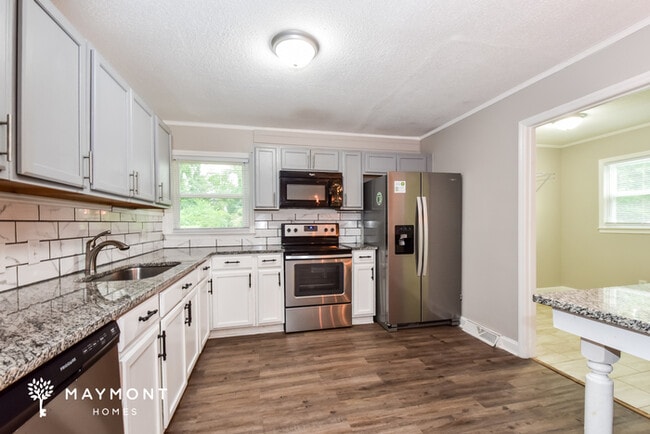
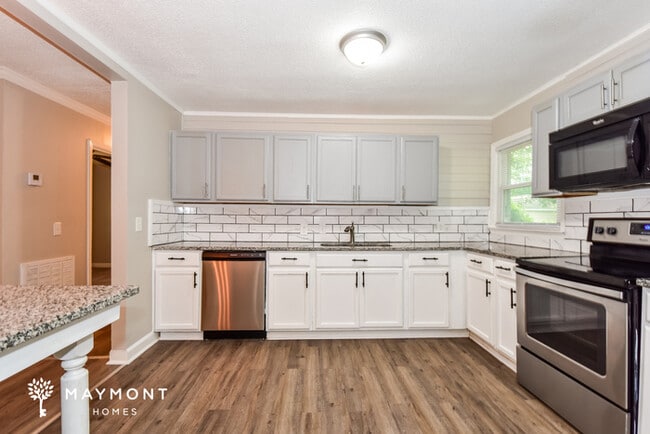
The kitchen blends style and function with granite countertops, subway tile backsplash, stainless steel appliances, and two-toned cabinetry that creates a clean, modern look. All three bedrooms offer comfort with plush carpet, ceiling fans, and closet storage, while the bathrooms are designed with practicality in mind, each offering a tub/shower combo for convenience. The dedicated laundry room adds to the home’s functionality.
Outdoors, a large backyard framed by mature trees provides plenty of space to enjoy the Carolina sunshine. Located just less than 7 miles to downtown Columbia, this home gives you quick access to local dining, shopping, and entertainment. Don’t wait, apply now!
*Maymont Homes provides residents with convenient solutions, including simplified utility billing and flexible rent payment options. Contact us for more details.
This information is deemed reliable, but not guaranteed. All measurements are approximate. Actual product and home specifications may vary in dimension or detail. Images are for representational purposes only. Some programs and services may not be available in all market areas.
Prices and availability are subject to change without notice. Advertised rent prices do not include the required application fee, the partially refundable reservation fee (due upon application approval), or the mandatory monthly utility management fee (in select market areas.) Residents must maintain renters insurance as specified in their lease. If third-party renters insurance is not provided, residents will be automatically enrolled in our Master Insurance Policy for a fee. Select homes may be located in communities that require a monthly fee for community-specific amenities or services.
For complete details, please contact a company leasing representative. Equal Housing Opportunity.
Estimated availability date is subject to change based on construction timelines and move-out confirmation.
This property allows self guided viewing without an appointment. Contact for details.

Map
- 106 Stockman Dr
- 615 Dawn Dr
- 104 Dryden Ct
- 154 Stonewood Dr
- 725 Brooks Ave
- 705 Oakland Ave
- 2405 Rainbow Dr
- 190 Stonewood Dr
- 3002 Hilldale Rd
- 3004 Hilldale Rd
- 2312 Rainbow Dr
- 349 Gum Swamp Trail
- 339 Gum Swamp Trail
- 3012 Glendale Rd
- 706 Westside Dr
- 3107 Trailstream Rd
- 135 Silver Run Place
- 826 Jefferson St
- 116 Silver Run Place
- 3211 Oakdale Rd
- 258 Gum Swamp Trail
- 135 Silver Run Place
- 2805 Shadblow Ln
- 3308 Oakdale Rd
- 387 Pinaster Path
- 2705 Leaphart Rd
- 227 17th St
- 1541 Beckham St
- 316 Autumn Mist Dr
- 1321 Lafayette Ave
- 1513 Dunbar Rd
- 1235 Jensen St
- 1803 Frink St
- 1005 New Brookland Place Unit 1005
- 10 Carroll Ct
- 1423 Lucas St
- 1206 N Eden Dr
- 2336 James St
- 118 Goldleaf St
- 815 Raleigh St