Estimated Value: $216,798 - $265,000
3
Beds
1
Bath
1,196
Sq Ft
$200/Sq Ft
Est. Value
About This Home
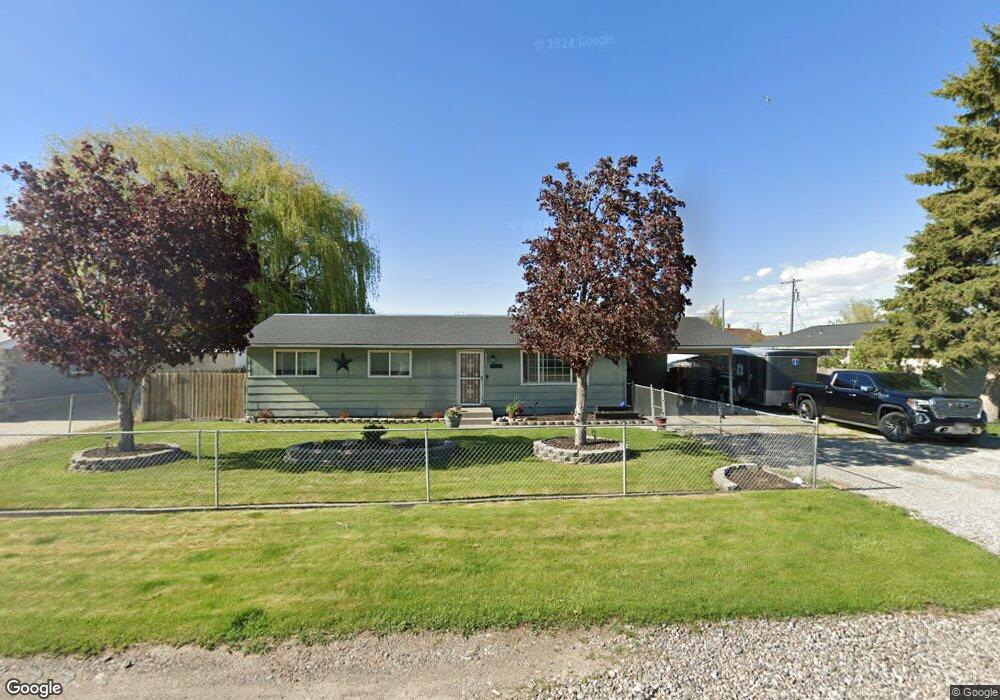
This home is located at 533 E Clark St, Paul, ID 83347 and is currently estimated at $238,950, approximately $199 per square foot. 533 E Clark St is a home located in Minidoka County with nearby schools including Paul Elementary School, Minico Senior High School, and Artec Charter School.
Ownership History
Date
Name
Owned For
Owner Type
Purchase Details
Closed on
Jun 15, 2016
Sold by
Rodriguez Edgar
Bought by
Rodriguez Edgar and Rodriguez Monica
Current Estimated Value
Purchase Details
Closed on
Apr 9, 2010
Sold by
Perez Claudia and Peterson Kris
Bought by
Rodriguez Edgar
Home Financials for this Owner
Home Financials are based on the most recent Mortgage that was taken out on this home.
Original Mortgage
$101,898
Outstanding Balance
$67,637
Interest Rate
5.01%
Mortgage Type
New Conventional
Estimated Equity
$171,313
Purchase Details
Closed on
Apr 3, 2008
Sold by
Perez Ruben
Bought by
Perez Claudia S
Purchase Details
Closed on
May 26, 2006
Sold by
Montes Rodolfo and Montes Celina
Bought by
Perez Ruben and Perez Claudia
Home Financials for this Owner
Home Financials are based on the most recent Mortgage that was taken out on this home.
Original Mortgage
$72,770
Interest Rate
6.46%
Mortgage Type
New Conventional
Create a Home Valuation Report for This Property
The Home Valuation Report is an in-depth analysis detailing your home's value as well as a comparison with similar homes in the area
Purchase History
| Date | Buyer | Sale Price | Title Company |
|---|---|---|---|
| Rodriguez Edgar | -- | Titleone Rupert Patty Temple | |
| Rodriguez Edgar | -- | -- | |
| Rodriguez Edgar | -- | -- | |
| Perez Claudia S | -- | -- | |
| Perez Ruben | -- | -- |
Source: Public Records
Mortgage History
| Date | Status | Borrower | Loan Amount |
|---|---|---|---|
| Open | Rodriguez Edgar | $101,898 | |
| Previous Owner | Perez Ruben | $72,770 |
Source: Public Records
Tax History
| Year | Tax Paid | Tax Assessment Tax Assessment Total Assessment is a certain percentage of the fair market value that is determined by local assessors to be the total taxable value of land and additions on the property. | Land | Improvement |
|---|---|---|---|---|
| 2025 | $839 | $192,421 | $20,671 | $171,750 |
| 2024 | $875 | $192,421 | $20,671 | $171,750 |
| 2023 | $720 | $184,231 | $20,671 | $163,560 |
| 2022 | $904 | $158,584 | $17,984 | $140,600 |
| 2021 | $834 | $119,982 | $12,962 | $107,020 |
| 2020 | $799 | $109,009 | $9,939 | $99,070 |
| 2019 | $789 | $98,779 | $0 | $0 |
| 2018 | $708 | $83,419 | $9,939 | $73,480 |
| 2017 | $705 | $86,557 | $7,957 | $78,600 |
| 2016 | $640 | $36,955 | $0 | $0 |
| 2015 | $694 | $0 | $0 | $0 |
| 2014 | $694 | $0 | $0 | $0 |
| 2012 | -- | $0 | $0 | $0 |
Source: Public Records
Map
Nearby Homes
- 204 E Idaho St
- 203 E Idaho St
- TBD W Clark St
- 11 N 3rd West St
- 603 Manning Cir
- 708 W Clark St
- 664 Columbine Dr
- 629 Manning Cir
- Parcel 1 300 South Rd
- Parcel 2 300 South Rd
- Parcel 4 300 South Rd
- Parcel 3 300 South Rd
- 415 W 300 S
- 350 S 500 W
- 150 S 600 West Rd
- 451 W 200 N
- 89 S 860 Rd W
- 350 400 Rd W
- 1732 and 1734 Dollys Way
- 2050 Kings Row
Your Personal Tour Guide
Ask me questions while you tour the home.