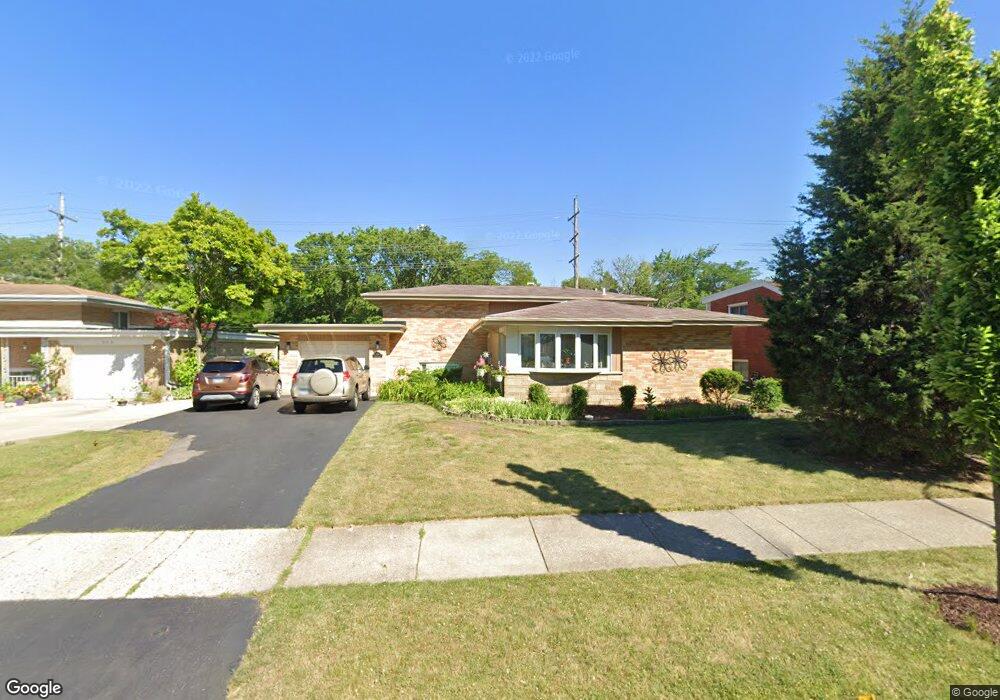
533 E Park Ave Elmhurst, IL 60126
Estimated Value: $476,000 - $519,000
3
Beds
2
Baths
1,213
Sq Ft
$410/Sq Ft
Est. Value
About This Home
This home is located at 533 E Park Ave, Elmhurst, IL 60126 and is currently estimated at $497,699, approximately $410 per square foot. 533 E Park Ave is a home located in DuPage County with nearby schools including Edison Elementary School, Sandburg Middle School, and York Community High School.
Ownership History
Date
Name
Owned For
Owner Type
Purchase Details
Closed on
Jun 24, 2016
Sold by
Placey Mark W and Placey Jill A
Bought by
Placey Jill A and Tesi Jill A
Current Estimated Value
Home Financials for this Owner
Home Financials are based on the most recent Mortgage that was taken out on this home.
Original Mortgage
$246,000
Outstanding Balance
$199,222
Interest Rate
4.12%
Mortgage Type
New Conventional
Estimated Equity
$298,477
Purchase Details
Closed on
Jul 28, 2000
Sold by
Brettman William A and William A Brettman Living Trus
Bought by
Placey Mark W and Placey Jill A
Home Financials for this Owner
Home Financials are based on the most recent Mortgage that was taken out on this home.
Original Mortgage
$214,200
Interest Rate
8.26%
Purchase Details
Closed on
Oct 19, 1999
Sold by
Brettman William A
Bought by
Brettman William A and William A Brettman Revocable Living Trus
Create a Home Valuation Report for This Property
The Home Valuation Report is an in-depth analysis detailing your home's value as well as a comparison with similar homes in the area
Home Values in the Area
Average Home Value in this Area
Purchase History
| Date | Buyer | Sale Price | Title Company |
|---|---|---|---|
| Placey Jill A | -- | Chicago Title | |
| Placey Mark W | $238,000 | -- | |
| Brettman William A | -- | -- |
Source: Public Records
Mortgage History
| Date | Status | Borrower | Loan Amount |
|---|---|---|---|
| Open | Placey Jill A | $246,000 | |
| Closed | Placey Mark W | $214,200 |
Source: Public Records
Tax History
| Year | Tax Paid | Tax Assessment Tax Assessment Total Assessment is a certain percentage of the fair market value that is determined by local assessors to be the total taxable value of land and additions on the property. | Land | Improvement |
|---|---|---|---|---|
| 2024 | $8,287 | $145,502 | $85,495 | $60,007 |
| 2023 | $7,683 | $134,550 | $79,060 | $55,490 |
| 2022 | $7,479 | $129,330 | $75,990 | $53,340 |
| 2021 | $7,291 | $126,110 | $74,100 | $52,010 |
| 2020 | $7,007 | $123,350 | $72,480 | $50,870 |
| 2019 | $6,854 | $117,270 | $68,910 | $48,360 |
| 2018 | $6,470 | $110,430 | $65,220 | $45,210 |
| 2017 | $6,322 | $105,230 | $62,150 | $43,080 |
| 2016 | $6,182 | $99,130 | $58,550 | $40,580 |
| 2015 | $6,112 | $92,350 | $54,550 | $37,800 |
| 2014 | $6,307 | $87,840 | $43,310 | $44,530 |
| 2013 | $6,241 | $89,080 | $43,920 | $45,160 |
Source: Public Records
Map
Nearby Homes
- 1038 Arthur Ave
- 330 E Saint Charles Rd
- 444 E Schiller St
- 377 S Prairie Ave
- 406 S Poplar Ave
- 515 S Parkview Ave
- 209 N Maison Ct
- 1428 1/2 N Ashbel Ave
- 5706 Saint Charles Rd
- 5700 Saint Charles Rd
- 1447 N Ashbel Ave
- 175 N Berteau Ave
- 220 N Geneva Ave
- 153 S Kenmore Ave
- 251 E South St
- 224 E May St
- 110 N Willow Rd
- 566 S Cedar Ave
- 176 S Arlington Ave
- 593 S Edgewood Ave
- 537 E Park Ave
- 529 E Park Ave
- 541 E Park Ave
- 525 E Park Ave
- 534 E Park Ave
- 530 E Park Ave
- 523 E Park Ave
- 538 E Park Ave
- 545 E Park Ave
- 526 E Park Ave
- 542 E Park Ave
- 522 E Park Ave
- 546 E Park Ave
- 519 E Park Ave
- 414 E Atwater Ave
- 518 E Park Ave
- 416 E Atwater Ave
- 553 E Park Ave
- 550 E Park Ave
- 517 E Park Ave
Your Personal Tour Guide
Ask me questions while you tour the home.