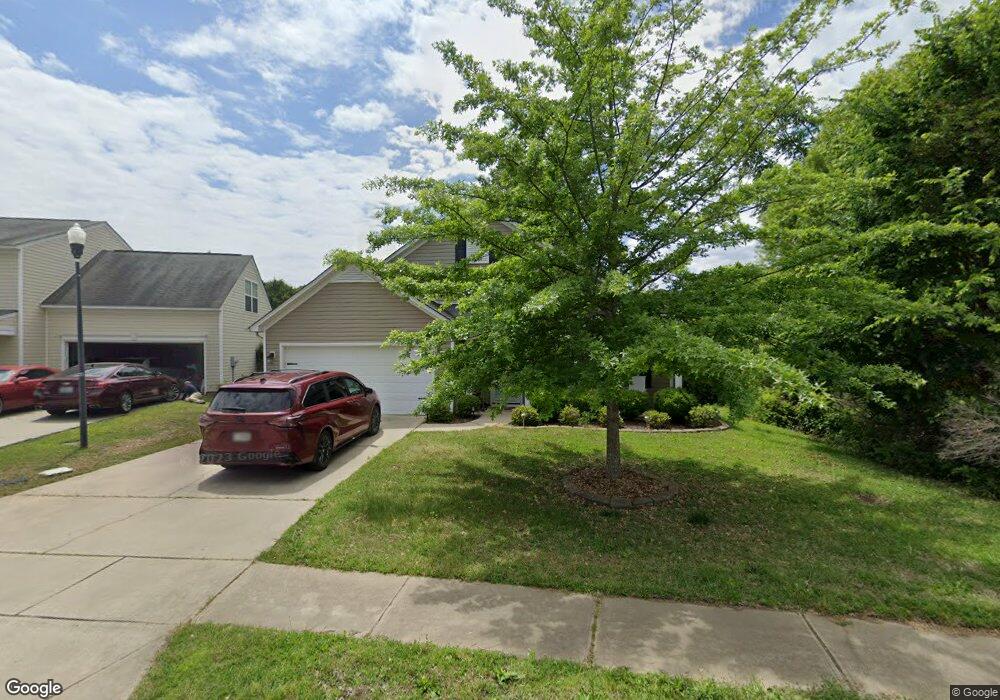
533 Foxstone Dr Chapin, SC 29036
Estimated Value: $268,000 - $312,953
4
Beds
3
Baths
2,050
Sq Ft
$145/Sq Ft
Est. Value
About This Home
This home is located at 533 Foxstone Dr, Chapin, SC 29036 and is currently estimated at $298,238, approximately $145 per square foot. 533 Foxstone Dr is a home located in Richland County with nearby schools including Lake Murray Elementary School, Chapin Intermediate, and Chapin High School.
Ownership History
Date
Name
Owned For
Owner Type
Purchase Details
Closed on
Jan 14, 2022
Sold by
Adam Leaphart
Bought by
Tran Vinh
Current Estimated Value
Purchase Details
Closed on
Jul 29, 2016
Sold by
Sullivan Michael T and Sullivan Mariska E
Bought by
Leaphart Adam and Leaphart Valerie M
Home Financials for this Owner
Home Financials are based on the most recent Mortgage that was taken out on this home.
Original Mortgage
$163,800
Interest Rate
3.54%
Mortgage Type
New Conventional
Purchase Details
Closed on
Mar 4, 2014
Sold by
Turner J Ethan
Bought by
Sullivan Michael T and Sullivan Mariska E
Home Financials for this Owner
Home Financials are based on the most recent Mortgage that was taken out on this home.
Original Mortgage
$166,250
Interest Rate
4.43%
Mortgage Type
New Conventional
Purchase Details
Closed on
Sep 5, 2008
Sold by
Mungo Homes Inc
Bought by
Turner J Ethan
Home Financials for this Owner
Home Financials are based on the most recent Mortgage that was taken out on this home.
Original Mortgage
$194,085
Interest Rate
6.48%
Mortgage Type
VA
Create a Home Valuation Report for This Property
The Home Valuation Report is an in-depth analysis detailing your home's value as well as a comparison with similar homes in the area
Home Values in the Area
Average Home Value in this Area
Purchase History
| Date | Buyer | Sale Price | Title Company |
|---|---|---|---|
| Tran Vinh | $260,000 | None Listed On Document | |
| Leaphart Adam | $182,000 | None Available | |
| Sullivan Michael T | $175,000 | None Available | |
| Turner J Ethan | $190,920 | -- |
Source: Public Records
Mortgage History
| Date | Status | Borrower | Loan Amount |
|---|---|---|---|
| Previous Owner | Leaphart Adam | $163,800 | |
| Previous Owner | Sullivan Michael T | $166,250 | |
| Previous Owner | Turner J Ethan | $194,085 |
Source: Public Records
Tax History
| Year | Tax Paid | Tax Assessment Tax Assessment Total Assessment is a certain percentage of the fair market value that is determined by local assessors to be the total taxable value of land and additions on the property. | Land | Improvement |
|---|---|---|---|---|
| 2024 | $2,283 | $262,700 | $36,000 | $226,700 |
| 2023 | $2,194 | $7,300 | $0 | $0 |
| 2022 | $1,591 | $182,500 | $26,400 | $156,100 |
| 2021 | $5,076 | $10,950 | $0 | $0 |
| 2020 | $1,671 | $7,300 | $0 | $0 |
| 2019 | $1,651 | $7,300 | $0 | $0 |
| 2018 | $1,460 | $7,280 | $0 | $0 |
| 2017 | $1,423 | $7,280 | $0 | $0 |
| 2016 | $1,371 | $7,000 | $0 | $0 |
| 2015 | $1,378 | $7,000 | $0 | $0 |
| 2014 | $1,370 | $174,300 | $0 | $0 |
| 2013 | -- | $6,970 | $0 | $0 |
Source: Public Records
Map
Nearby Homes
- 334 Murray Falls Ln
- 327 Murray Falls Ln
- 328 Murray Falls Ln
- 7 Elk Run Ct
- 8 Elk Run Ct
- 13 Elk Run Ct
- 313 Murray Falls Ln
- 120 Spring Blossom Ln
- 19 Elk Run Ct
- 20 Elk Run Ct
- 28 Elk Run Ct
- 29 Elk Run Ct
- 822 Ruskin Dr
- 142 Almofini Ln
- 515 Malachite Ln
- 53 Starry Night Ct
- 509 Malachite Ln
- 1318 Portrait Hill Dr
- 13 Botticelli Ct
- 175 Almofini Ln
- 529 Foxstone Dr
- 525 Foxstone Dr
- 520 Foxstone Dr
- 530 Foxstone Dr
- 337 Foxport Dr
- 521 Foxstone Dr
- 540 Foxstone Dr
- 341 Foxport Dr
- 333 Foxport Dr
- 517 Foxstone Dr
- 357 Foxport Dr
- 345 Foxport Dr
- 546 Foxstone Dr
- 351 Foxport Dr
- 365 Foxport Dr
- 361 Foxport Dr
- 516 Foxstone Dr
- 64 Crossfox Ct
- 507 Foxstone Dr
- 68 Crossfox Ct
Your Personal Tour Guide
Ask me questions while you tour the home.