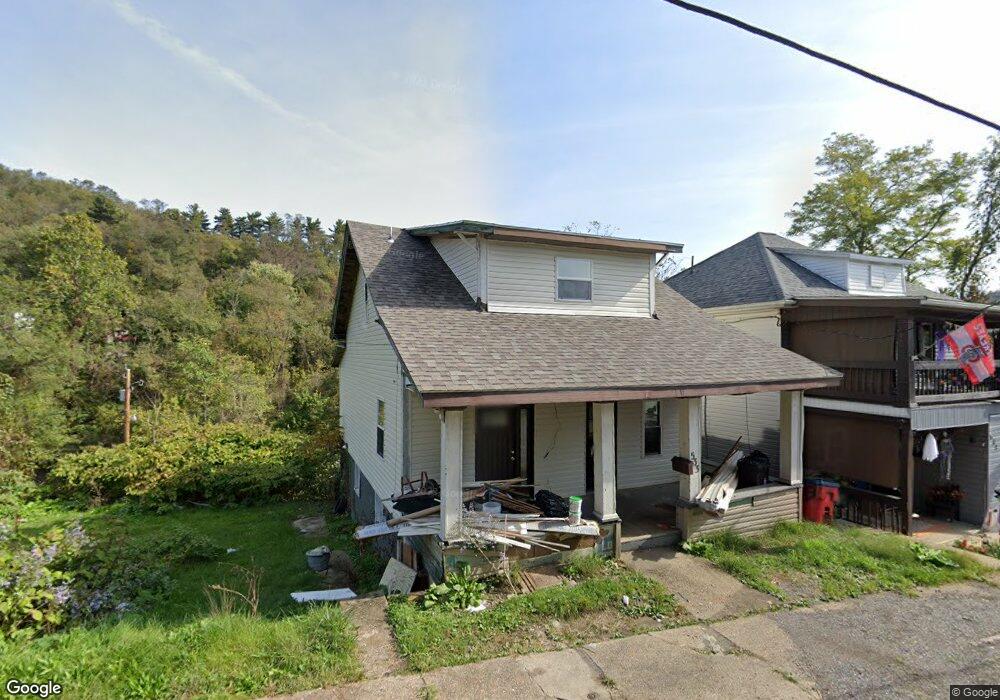
533 N 7th St Martins Ferry, OH 43935
Estimated Value: $60,000 - $78,000
3
Beds
1
Bath
1,008
Sq Ft
$66/Sq Ft
Est. Value
About This Home
This home is located at 533 N 7th St, Martins Ferry, OH 43935 and is currently estimated at $66,703, approximately $66 per square foot. 533 N 7th St is a home located in Belmont County with nearby schools including Anna Marie Ayers Elementary School, Martins Ferry Middle School, and Martins Ferry High School.
Ownership History
Date
Name
Owned For
Owner Type
Purchase Details
Closed on
Jul 19, 2019
Sold by
Williams Robert and Williams Robert E
Bought by
Mcghee Valley Properties Llc
Current Estimated Value
Purchase Details
Closed on
Aug 15, 2014
Sold by
Bennet Christopher Michael
Bought by
Williams Robert
Purchase Details
Closed on
Nov 14, 2009
Sold by
Delbert Alberta E
Bought by
Bennett Christopher Micahel
Purchase Details
Closed on
Jan 1, 1987
Sold by
Delbert Phillip and Alberta Delbert
Bought by
Delbert Phillip and Delbert Alberta
Create a Home Valuation Report for This Property
The Home Valuation Report is an in-depth analysis detailing your home's value as well as a comparison with similar homes in the area
Home Values in the Area
Average Home Value in this Area
Purchase History
| Date | Buyer | Sale Price | Title Company |
|---|---|---|---|
| Mcghee Valley Properties Llc | $3,500 | None Available | |
| Williams Robert | $1,366 | Attorney | |
| Bennett Christopher Micahel | $4,000 | Attorney | |
| Bennett Christopher Michael | $4,000 | Attorney | |
| Delbert Phillip | -- | -- |
Source: Public Records
Tax History Compared to Growth
Tax History
| Year | Tax Paid | Tax Assessment Tax Assessment Total Assessment is a certain percentage of the fair market value that is determined by local assessors to be the total taxable value of land and additions on the property. | Land | Improvement |
|---|---|---|---|---|
| 2024 | $570 | $13,530 | $1,310 | $12,220 |
| 2023 | $462 | $10,060 | $1,070 | $8,990 |
| 2022 | $462 | $10,062 | $1,074 | $8,988 |
| 2021 | $459 | $10,062 | $1,074 | $8,988 |
| 2020 | $431 | $8,750 | $930 | $7,820 |
| 2019 | $954 | $8,750 | $930 | $7,820 |
| 2018 | $901 | $8,750 | $930 | $7,820 |
| 2017 | $337 | $6,870 | $630 | $6,240 |
| 2016 | $446 | $6,870 | $630 | $6,240 |
| 2015 | $644 | $6,870 | $630 | $6,240 |
| 2014 | $582 | $8,890 | $570 | $8,320 |
| 2013 | $597 | $8,890 | $570 | $8,320 |
Source: Public Records
Map
Nearby Homes