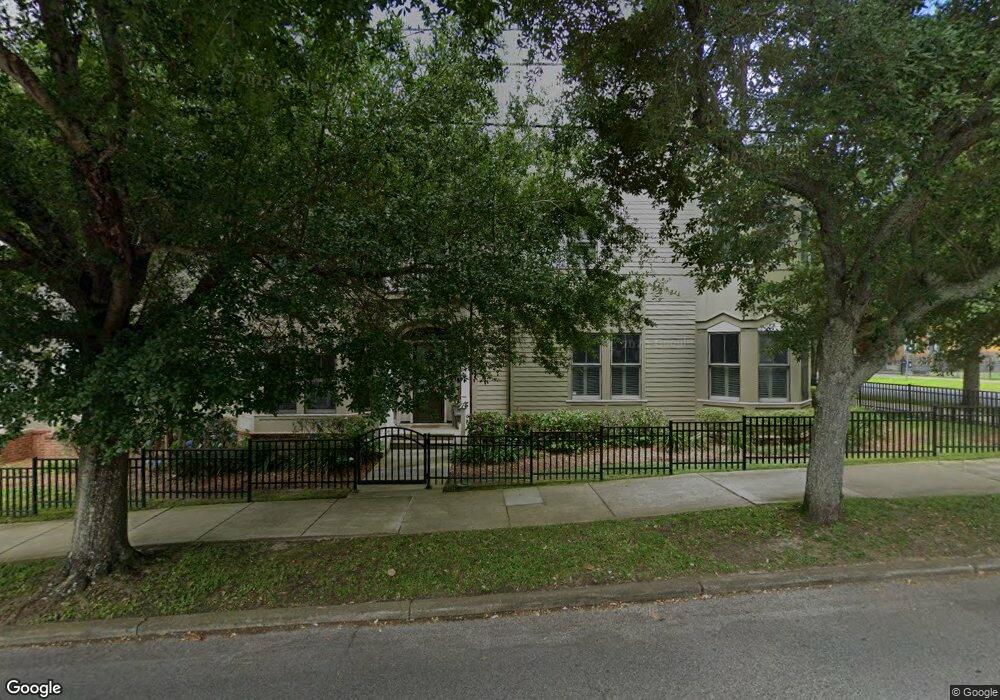
533 N Spring St Unit 2 Pensacola, FL 32501
Estimated Value: $466,090 - $490,000
--
Bed
2
Baths
1,585
Sq Ft
$302/Sq Ft
Est. Value
About This Home
This home is located at 533 N Spring St Unit 2, Pensacola, FL 32501 and is currently estimated at $479,023, approximately $302 per square foot. 533 N Spring St Unit 2 is a home located in Escambia County with nearby schools including J.H. Workman Middle School, Pensacola High School, and Episcopal Day School of Christ Church Parish.
Ownership History
Date
Name
Owned For
Owner Type
Purchase Details
Closed on
Aug 11, 2011
Sold by
Fannie Mae
Bought by
Wells Foster Peggy A
Current Estimated Value
Home Financials for this Owner
Home Financials are based on the most recent Mortgage that was taken out on this home.
Original Mortgage
$151,920
Outstanding Balance
$12,594
Interest Rate
4.62%
Mortgage Type
New Conventional
Estimated Equity
$466,429
Purchase Details
Closed on
Mar 30, 2011
Sold by
Bac Home Loans Ervicig Lp
Bought by
Fannie Mae and Federal National Moragage Association
Purchase Details
Closed on
Sep 30, 2010
Sold by
Hamlin Michael N and Crigler Jeffrey L
Bought by
Bac Home Loans Servicing Lp and Countrywide Home Loans Servicing Lp
Purchase Details
Closed on
May 18, 2007
Sold by
Snowmass Mountain Properties Llc
Bought by
Hamlin Michael N and Crigler Jeffrey
Home Financials for this Owner
Home Financials are based on the most recent Mortgage that was taken out on this home.
Original Mortgage
$327,196
Interest Rate
6.17%
Mortgage Type
New Conventional
Create a Home Valuation Report for This Property
The Home Valuation Report is an in-depth analysis detailing your home's value as well as a comparison with similar homes in the area
Home Values in the Area
Average Home Value in this Area
Purchase History
| Date | Buyer | Sale Price | Title Company |
|---|---|---|---|
| Wells Foster Peggy A | $189,900 | Reo Title Company Of Florida | |
| Fannie Mae | -- | Reo Title Company Of Florida | |
| Bac Home Loans Servicing Lp | $318,500 | Attorney | |
| Hamlin Michael N | $409,000 | None Available |
Source: Public Records
Mortgage History
| Date | Status | Borrower | Loan Amount |
|---|---|---|---|
| Open | Wells Foster Peggy A | $151,920 | |
| Previous Owner | Hamlin Michael N | $327,196 |
Source: Public Records
Tax History Compared to Growth
Tax History
| Year | Tax Paid | Tax Assessment Tax Assessment Total Assessment is a certain percentage of the fair market value that is determined by local assessors to be the total taxable value of land and additions on the property. | Land | Improvement |
|---|---|---|---|---|
| 2024 | $2,150 | $173,702 | -- | -- |
| 2023 | $2,150 | $168,643 | $0 | $0 |
| 2022 | $2,085 | $163,732 | $0 | $0 |
| 2021 | $2,062 | $158,964 | $0 | $0 |
| 2020 | $2,005 | $156,770 | $0 | $0 |
| 2019 | $1,960 | $153,246 | $0 | $0 |
| 2018 | $1,945 | $150,389 | $0 | $0 |
| 2017 | $1,928 | $147,296 | $0 | $0 |
| 2016 | $1,904 | $144,267 | $0 | $0 |
| 2015 | $1,913 | $143,265 | $0 | $0 |
| 2014 | $1,916 | $142,128 | $0 | $0 |
Source: Public Records
Map
Nearby Homes
- 525 N Spring St Unit 6
- 217 W Jackson St Unit 12
- 104 W Jackson St
- 127 W Belmont St
- 16 W La Rua St
- 520 N de Villiers St Unit A & B
- 504 N de Villiers St Unit A & B
- 536 N de Villiers St Unit A & B
- 401 W Wright St
- 115 W Wright St
- 14 W Gadsden St
- 804 N Baylen St
- 283 Junction Ave
- 400 W Gregory St
- 805 Covington Place E
- 518 N Coyle St
- 522 W Belmont St
- 300 N de Villiers St
- 602 W Jackson St
- 411 N Coyle St
- 208 W La Rua St Unit 19
- 529 N Spring St Unit 4
- 204 W La Rua St Unit 21
- 203 W Jackson St Unit 9
- 214 W La Rua St Unit 16
- 531 N Spring St Unit 3
- 211 W Jackson St Unit 15
- 525 N Spring St
- 212 W La Rua St Unit 17
- 215 W Jackson St Unit 13
- 207 W Jackson St Unit 11
- 205 W Jackson St Unit 10
- 203 W Jackson St
- 213 W Jackson St
- 527 N Spring St Unit 5
- 529 N Spring St
- 202 W La Rua St Unit 22
- 204 W La Rua St
- 206 W La Rua St Unit 20
- 210 W La Rua St Unit 18