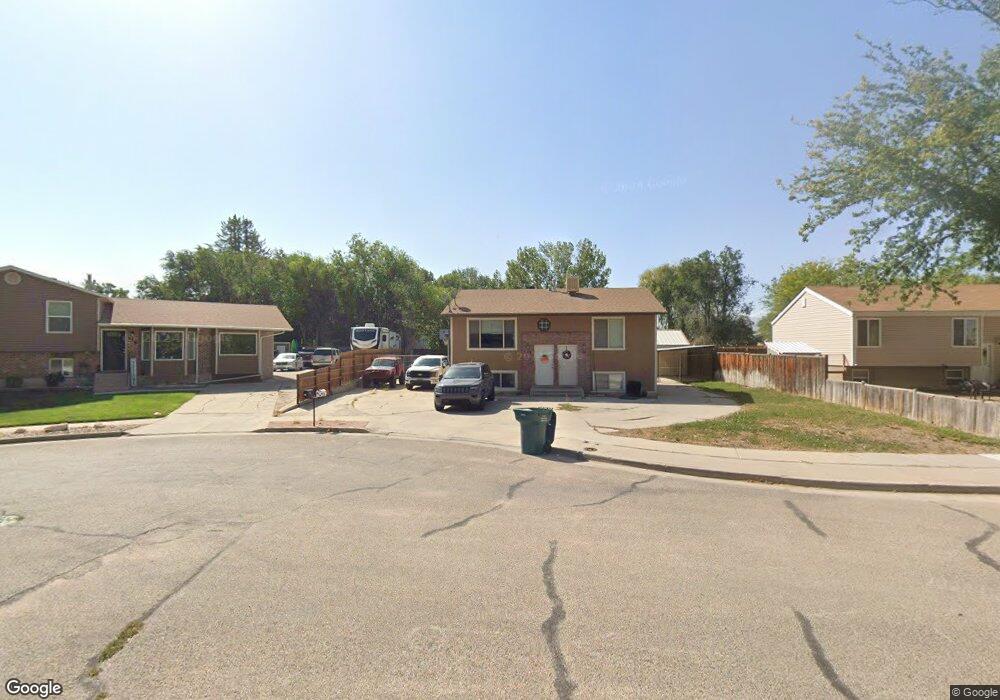
533 N Sundance Cir Unit 537 Vernal, UT 84078
Estimated Value: $205,000 - $356,000
6
Beds
2
Baths
2,176
Sq Ft
$131/Sq Ft
Est. Value
About This Home
This home is located at 533 N Sundance Cir Unit 537, Vernal, UT 84078 and is currently estimated at $285,343, approximately $131 per square foot. 533 N Sundance Cir Unit 537 is a home located in Uintah County with nearby schools including Ashley School, Uintah Middle School, and Vernal Middle School.
Ownership History
Date
Name
Owned For
Owner Type
Purchase Details
Closed on
Jun 1, 2022
Sold by
Hemstreet Family Properties Llc
Bought by
Talk N Rock Properties Llc
Current Estimated Value
Home Financials for this Owner
Home Financials are based on the most recent Mortgage that was taken out on this home.
Original Mortgage
$176,798
Outstanding Balance
$167,973
Interest Rate
5.1%
Mortgage Type
New Conventional
Estimated Equity
$117,370
Purchase Details
Closed on
Mar 8, 2010
Sold by
Hemstreet Glen A and Hemstreet Tina L
Bought by
Hemstreet Family Properties Llc
Purchase Details
Closed on
Jun 3, 2005
Sold by
Hemstreet Glen A and Hemstreet Tina L
Bought by
Hemstreet Glen A and Hemstreet Tina L
Home Financials for this Owner
Home Financials are based on the most recent Mortgage that was taken out on this home.
Original Mortgage
$80,500
Interest Rate
5.74%
Mortgage Type
New Conventional
Create a Home Valuation Report for This Property
The Home Valuation Report is an in-depth analysis detailing your home's value as well as a comparison with similar homes in the area
Home Values in the Area
Average Home Value in this Area
Purchase History
| Date | Buyer | Sale Price | Title Company |
|---|---|---|---|
| Talk N Rock Properties Llc | -- | None Listed On Document | |
| Talk N Rock Properties Llc | -- | None Listed On Document | |
| Hemstreet Family Properties Llc | -- | -- | |
| Hemstreet Glen A | -- | -- | |
| Hemstreet Glen A | -- | -- |
Source: Public Records
Mortgage History
| Date | Status | Borrower | Loan Amount |
|---|---|---|---|
| Open | Talk N Rock Properties Llc | $176,798 | |
| Closed | Talk N Rock Properties Llc | $176,798 | |
| Previous Owner | Hemstreet Glen A | $80,500 |
Source: Public Records
Tax History Compared to Growth
Tax History
| Year | Tax Paid | Tax Assessment Tax Assessment Total Assessment is a certain percentage of the fair market value that is determined by local assessors to be the total taxable value of land and additions on the property. | Land | Improvement |
|---|---|---|---|---|
| 2024 | $1,122 | $127,403 | $17,308 | $110,095 |
| 2023 | $1,122 | $110,608 | $17,308 | $93,300 |
| 2022 | $995 | $92,123 | $13,027 | $79,096 |
| 2021 | $1,019 | $77,860 | $13,027 | $64,833 |
| 2020 | $902 | $70,913 | $13,027 | $57,886 |
| 2019 | $914 | $70,913 | $13,027 | $57,886 |
| 2018 | $915 | $70,913 | $13,027 | $57,886 |
| 2017 | $10 | $75,976 | $16,284 | $59,692 |
| 2016 | $1,013 | $86,510 | $16,284 | $70,226 |
| 2015 | $936 | $86,510 | $16,284 | $70,226 |
| 2014 | $924 | $86,510 | $16,284 | $70,226 |
| 2013 | $944 | $86,510 | $16,284 | $70,226 |
Source: Public Records
Map
Nearby Homes
- 536 N Sundance Cir
- 268 W 500 N
- 278 W 350 N Unit C
- 2460 N 250 W
- 2425 N Vernal Ave
- 525 N 100 E
- 692 N 500 W
- 350 N 500 W
- 590 E 600 N Unit 32
- 628 E 600 N Unit 34
- 576 E 600 N Unit 4
- 142 N 300 W
- 237 N 500 W
- 725 W 350 N
- 729 W 350 N
- 129 N 500 W
- 150 E 750 N Unit 109
- 150 E 750 N Unit 71
- 689 W 250 N
- 482 E 700 N
- 575 N Sundance Cir
- 587 N Sundance Cir
- 526 N Sundance Cir Unit 529
- 526 N Sundance Cir Unit Sundan
- 570 N Sundance Cir
- 235 W 600 N
- 222 W 500 N
- 590 N Sundance Cir
- 194 W 500 N
- 572 N Sundance Cir
- 584 N 250 W
- 144 W 500 N
- 608 N 200 W
- 243 W 600 N
- 611 N 200 W
- 188 W 600 N
- 222 W 600 N
- 134 W 500 N
- 270 W 550 N
- 172 W 600 N