Estimated Value: $211,000 - $237,000
3
Beds
2
Baths
1,418
Sq Ft
$155/Sq Ft
Est. Value
About This Home
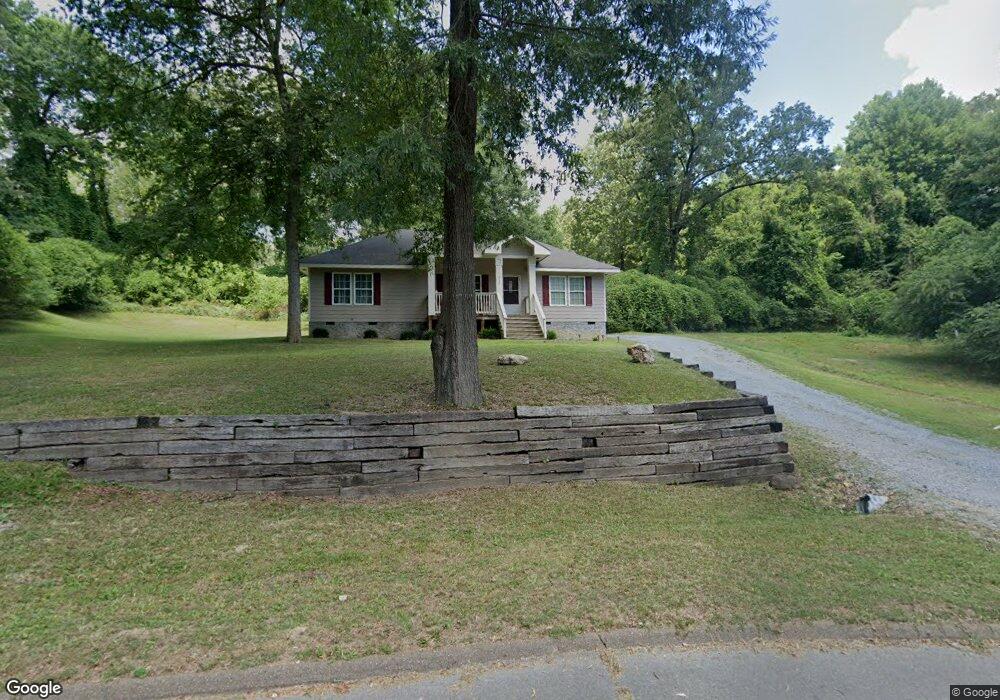
This home is located at 533 Ridge St, Trion, GA 30753 and is currently estimated at $219,373, approximately $154 per square foot. 533 Ridge St is a home located in Chattooga County with nearby schools including Trion Elementary School, Trion Middle School, and Trion High School.
Ownership History
Date
Name
Owned For
Owner Type
Purchase Details
Closed on
Feb 28, 2019
Sold by
Hartline Jimmie R
Bought by
Hartline Trudy Jane Chester
Current Estimated Value
Purchase Details
Closed on
Nov 25, 2009
Sold by
Hartline John H
Bought by
Hartline Jimmie R
Purchase Details
Closed on
Mar 5, 2008
Sold by
Not Provided
Bought by
Hartline John H
Purchase Details
Closed on
Oct 18, 2006
Sold by
Hartline Jimmie R
Bought by
Hartline Jimmy A
Purchase Details
Closed on
Aug 11, 2005
Sold by
Huey George
Bought by
Hartline Jimmie R
Create a Home Valuation Report for This Property
The Home Valuation Report is an in-depth analysis detailing your home's value as well as a comparison with similar homes in the area
Home Values in the Area
Average Home Value in this Area
Purchase History
| Date | Buyer | Sale Price | Title Company |
|---|---|---|---|
| Hartline Trudy Jane Chester | -- | -- | |
| Hartline Jimmie R | -- | -- | |
| Hartline John H | -- | -- | |
| Hartline John H | -- | -- | |
| Hartline Jimmy A | -- | -- | |
| Hartline Jimmie R | -- | -- |
Source: Public Records
Tax History Compared to Growth
Tax History
| Year | Tax Paid | Tax Assessment Tax Assessment Total Assessment is a certain percentage of the fair market value that is determined by local assessors to be the total taxable value of land and additions on the property. | Land | Improvement |
|---|---|---|---|---|
| 2024 | $1,913 | $80,080 | $2,040 | $78,040 |
| 2023 | $2,089 | $70,760 | $2,040 | $68,720 |
| 2022 | $565 | $35,177 | $2,166 | $33,011 |
| 2021 | $471 | $25,660 | $2,166 | $23,494 |
| 2020 | $503 | $25,660 | $2,166 | $23,494 |
| 2019 | $513 | $25,660 | $2,166 | $23,494 |
| 2018 | $471 | $25,363 | $2,166 | $23,197 |
| 2017 | $488 | $25,822 | $2,158 | $23,664 |
| 2016 | $391 | $25,822 | $2,158 | $23,664 |
| 2015 | -- | $23,286 | $2,158 | $21,128 |
| 2014 | -- | $23,286 | $2,158 | $21,128 |
| 2013 | -- | $23,286 | $2,158 | $21,128 |
Source: Public Records
Map
Nearby Homes