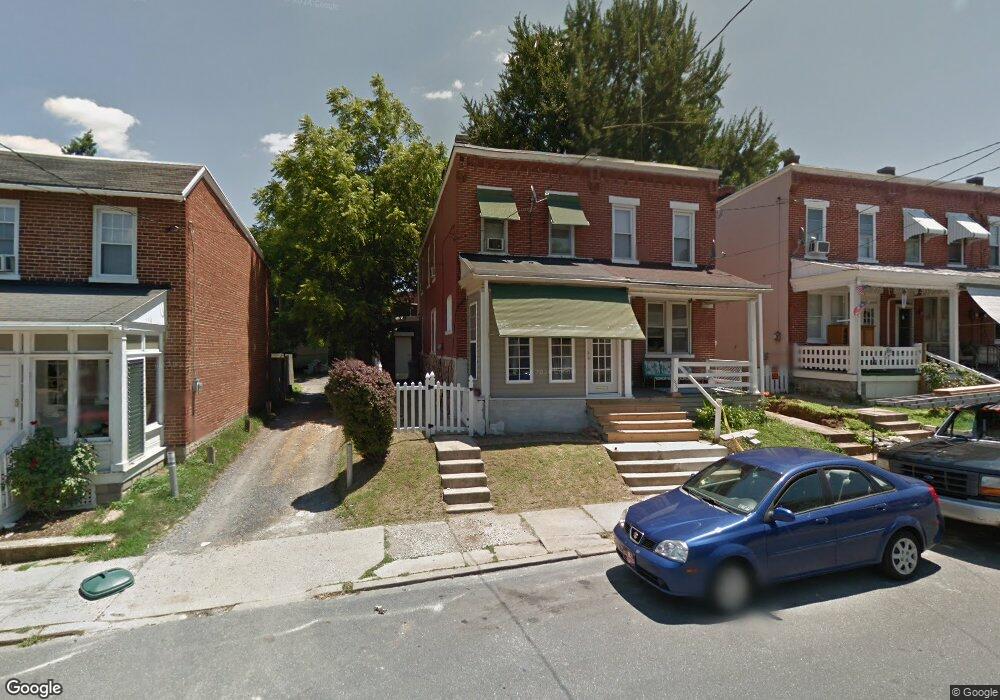
533 Ruby St Lancaster, PA 17603
West End NeighborhoodEstimated Value: $212,000 - $268,074
3
Beds
1
Bath
1,636
Sq Ft
$146/Sq Ft
Est. Value
About This Home
This home is located at 533 Ruby St, Lancaster, PA 17603 and is currently estimated at $239,019, approximately $146 per square foot. 533 Ruby St is a home located in Lancaster County with nearby schools including Lafayette Elementary School, Wheatland Middle School, and McCaskey High School.
Ownership History
Date
Name
Owned For
Owner Type
Purchase Details
Closed on
Jan 8, 2009
Sold by
Guillermo Quirci Y and Rodriguez Desiderio A
Bought by
Guillermo Quirci Y
Current Estimated Value
Home Financials for this Owner
Home Financials are based on the most recent Mortgage that was taken out on this home.
Original Mortgage
$91,829
Interest Rate
5.52%
Mortgage Type
FHA
Purchase Details
Closed on
Nov 12, 1998
Sold by
Hirt Eric
Bought by
Hirt Eric and Hirt Jessica
Create a Home Valuation Report for This Property
The Home Valuation Report is an in-depth analysis detailing your home's value as well as a comparison with similar homes in the area
Home Values in the Area
Average Home Value in this Area
Purchase History
| Date | Buyer | Sale Price | Title Company |
|---|---|---|---|
| Guillermo Quirci Y | -- | Service Link | |
| Hirt Eric | -- | -- |
Source: Public Records
Mortgage History
| Date | Status | Borrower | Loan Amount |
|---|---|---|---|
| Closed | Guillermo Quirci Y | $91,829 |
Source: Public Records
Tax History
| Year | Tax Paid | Tax Assessment Tax Assessment Total Assessment is a certain percentage of the fair market value that is determined by local assessors to be the total taxable value of land and additions on the property. | Land | Improvement |
|---|---|---|---|---|
| 2025 | $4,167 | $105,300 | $17,500 | $87,800 |
| 2024 | $4,167 | $105,300 | $17,500 | $87,800 |
| 2023 | $4,097 | $105,300 | $17,500 | $87,800 |
| 2022 | $3,926 | $105,300 | $17,500 | $87,800 |
| 2021 | $3,842 | $105,300 | $17,500 | $87,800 |
| 2020 | $3,842 | $105,300 | $17,500 | $87,800 |
| 2019 | $3,784 | $105,300 | $17,500 | $87,800 |
| 2018 | $4,409 | $105,300 | $17,500 | $87,800 |
| 2017 | $3,422 | $74,500 | $13,900 | $60,600 |
| 2016 | $3,391 | $74,500 | $13,900 | $60,600 |
| 2015 | $1,323 | $74,500 | $13,900 | $60,600 |
| 2014 | $2,532 | $74,500 | $13,900 | $60,600 |
Source: Public Records
Map
Nearby Homes
Your Personal Tour Guide
Ask me questions while you tour the home.