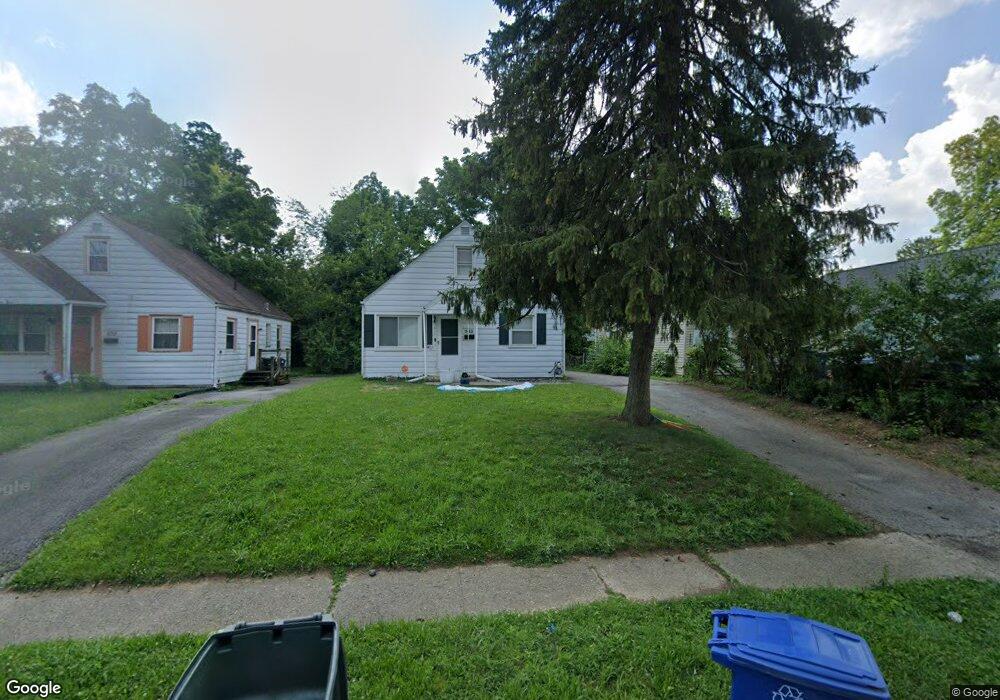
533 S Weyant Ave Columbus, OH 43213
Eastmoor NeighborhoodEstimated Value: $132,000 - $178,000
3
Beds
1
Bath
1,044
Sq Ft
$154/Sq Ft
Est. Value
About This Home
This home is located at 533 S Weyant Ave, Columbus, OH 43213 and is currently estimated at $161,099, approximately $154 per square foot. 533 S Weyant Ave is a home located in Franklin County with nearby schools including Fairmoor Elementary School, Johnson Park Middle School, and Walnut Ridge High School.
Ownership History
Date
Name
Owned For
Owner Type
Purchase Details
Closed on
Apr 2, 2020
Sold by
Gray John D
Bought by
Ote Properties Llc
Current Estimated Value
Purchase Details
Closed on
Jul 3, 2007
Sold by
Williams Andrew and Williams Kelly
Bought by
Gray John D
Purchase Details
Closed on
Jun 11, 2007
Sold by
Fonseca Esteban and Fonseca Cheryl L
Bought by
Williams Andrew and Williams Kelly
Purchase Details
Closed on
Feb 19, 2002
Sold by
Burson Willard L
Bought by
Fonseca Esteban
Home Financials for this Owner
Home Financials are based on the most recent Mortgage that was taken out on this home.
Original Mortgage
$71,900
Interest Rate
7.03%
Mortgage Type
Purchase Money Mortgage
Purchase Details
Closed on
Sep 7, 2000
Sold by
Home Investors Inc
Bought by
Burson Willard L
Purchase Details
Closed on
Jul 5, 2000
Sold by
Eckert William M and Resolution Trust Corp
Bought by
Home Investors Inc
Purchase Details
Closed on
Aug 27, 1986
Bought by
Eckert William M
Create a Home Valuation Report for This Property
The Home Valuation Report is an in-depth analysis detailing your home's value as well as a comparison with similar homes in the area
Home Values in the Area
Average Home Value in this Area
Purchase History
| Date | Buyer | Sale Price | Title Company |
|---|---|---|---|
| Ote Properties Llc | $60,000 | Total Title Services Llc | |
| Vb One Llc | $72,000 | Total Title Services | |
| Gray John D | $45,000 | Golden Titl | |
| Williams Andrew | $45,000 | Pillar Titl | |
| Fonseca Esteban | $79,900 | -- | |
| Burson Willard L | -- | Lawyers Title | |
| Home Investors Inc | $48,200 | Transohio Title | |
| Eckert William M | $42,000 | -- |
Source: Public Records
Mortgage History
| Date | Status | Borrower | Loan Amount |
|---|---|---|---|
| Previous Owner | Fonseca Esteban | $71,900 |
Source: Public Records
Tax History Compared to Growth
Tax History
| Year | Tax Paid | Tax Assessment Tax Assessment Total Assessment is a certain percentage of the fair market value that is determined by local assessors to be the total taxable value of land and additions on the property. | Land | Improvement |
|---|---|---|---|---|
| 2024 | $2,249 | $49,080 | $11,660 | $37,420 |
| 2023 | $2,221 | $49,070 | $11,655 | $37,415 |
| 2022 | $3,000 | $25,210 | $5,080 | $20,130 |
| 2021 | $1,560 | $25,210 | $5,080 | $20,130 |
| 2020 | $1,658 | $31,090 | $5,080 | $26,010 |
| 2019 | $1,878 | $25,630 | $4,240 | $21,390 |
| 2018 | $1,580 | $25,630 | $4,240 | $21,390 |
| 2017 | $1,598 | $25,630 | $4,240 | $21,390 |
| 2016 | $1,553 | $22,120 | $3,780 | $18,340 |
| 2015 | $1,418 | $22,120 | $3,780 | $18,340 |
| 2014 | $1,372 | $22,120 | $3,780 | $18,340 |
| 2013 | $763 | $23,310 | $3,990 | $19,320 |
Source: Public Records
Map
Nearby Homes
- 646 S Weyant Ave
- 647 S Napoleon Ave
- 708 S Waverly St
- 635 Elizabeth Ave
- 711 S Waverly St
- 733 S Napoleon Ave
- 622 S Ashburton Rd
- 430 S James Rd
- 3160 Fair Ave
- 565 S Kellner Rd
- 836 S Weyant Ave
- 526 Collingwood Ave
- 277 S James Rd
- 842 S Hampton Rd
- 201 S Weyant Ave
- 247 S James Rd
- 864 S Waverly St
- 804 S Ashburton Rd
- 892 Ruby Ave
- 178 S Weyant Ave
- 529 S Weyant Ave
- 539 S Weyant Ave
- 523 S Weyant Ave
- 545 S Weyant Ave
- 519 S Weyant Ave
- 528 S Waverly St
- 522 S Waverly St
- 532 S Waverly St
- 538 S Waverly St
- 518 S Waverly St
- 559 S Weyant Ave
- 536 S Weyant Ave
- 512 S Waverly St
- 542 S Weyant Ave
- 530 S Weyant Ave
- 524 S Weyant Ave
- 548 S Weyant Ave
- 506 S Waverly St
- 520 S Weyant Ave
- 563 S Weyant Ave