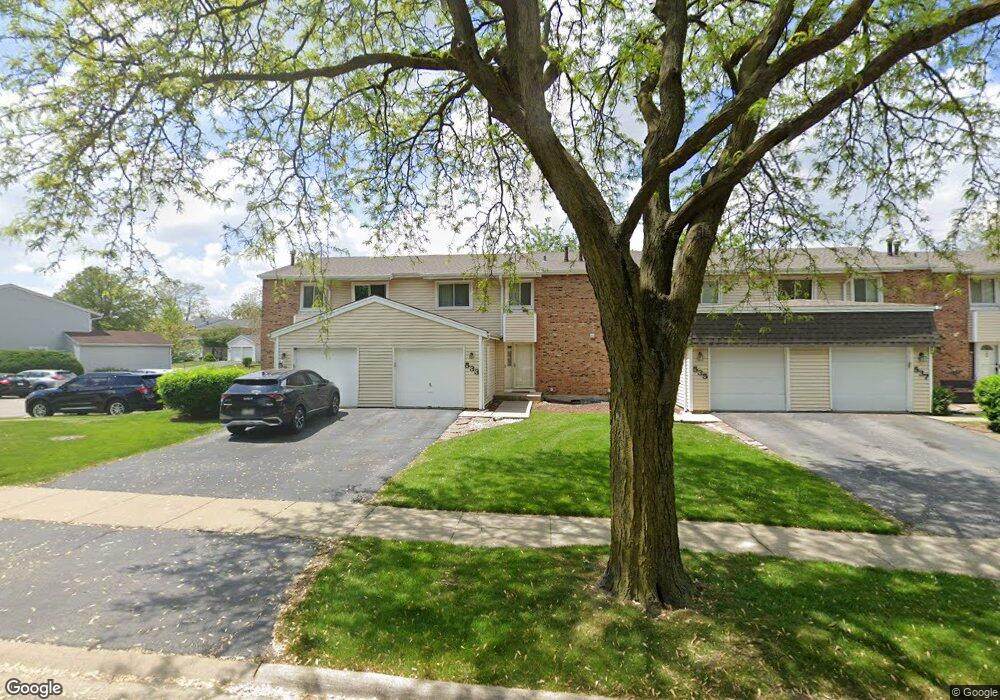
533 Thomas Rd Unit 533 Bolingbrook, IL 60440
Winston Woods NeighborhoodEstimated Value: $255,755 - $264,000
3
Beds
3
Baths
1,320
Sq Ft
$198/Sq Ft
Est. Value
About This Home
This home is located at 533 Thomas Rd Unit 533, Bolingbrook, IL 60440 and is currently estimated at $261,189, approximately $197 per square foot. 533 Thomas Rd Unit 533 is a home located in Will County with nearby schools including Wood View Elementary School, Bolingbrook High School, and Midwest Christian Montessori Academy.
Ownership History
Date
Name
Owned For
Owner Type
Purchase Details
Closed on
Nov 30, 2022
Sold by
Khokhar Nasir
Bought by
Khokhar Amber
Current Estimated Value
Purchase Details
Closed on
Jun 15, 2009
Sold by
Weichert Relocation Resources Inc
Bought by
Khokhar Nasir and Khokhar Mussarat
Purchase Details
Closed on
May 23, 2009
Sold by
Pitts Terry L and Pitts Kendra M
Bought by
Weichert Relocation Resources Inc
Purchase Details
Closed on
Oct 22, 2003
Sold by
Patrick Teresa J and Patrick Nicole D
Bought by
Pitts Terry L
Purchase Details
Closed on
May 31, 1994
Sold by
Eltoft Gary J and Eltoft Donna V
Bought by
Patrick Teresa J and Patrick Nicole D
Home Financials for this Owner
Home Financials are based on the most recent Mortgage that was taken out on this home.
Original Mortgage
$98,150
Interest Rate
8.58%
Mortgage Type
FHA
Create a Home Valuation Report for This Property
The Home Valuation Report is an in-depth analysis detailing your home's value as well as a comparison with similar homes in the area
Home Values in the Area
Average Home Value in this Area
Purchase History
| Date | Buyer | Sale Price | Title Company |
|---|---|---|---|
| Khokhar Amber | -- | -- | |
| Khokhar Nasir | $137,500 | Greater Illinois Title Co | |
| Weichert Relocation Resources Inc | $137,500 | Greater Illinois Title Co | |
| Pitts Terry L | $130,000 | Chicago Title Insurance Co | |
| Patrick Teresa J | $99,000 | -- |
Source: Public Records
Mortgage History
| Date | Status | Borrower | Loan Amount |
|---|---|---|---|
| Previous Owner | Patrick Teresa J | $98,150 |
Source: Public Records
Tax History
| Year | Tax Paid | Tax Assessment Tax Assessment Total Assessment is a certain percentage of the fair market value that is determined by local assessors to be the total taxable value of land and additions on the property. | Land | Improvement |
|---|---|---|---|---|
| 2024 | $7,208 | $78,043 | $7,893 | $70,150 |
| 2023 | $7,208 | $70,221 | $7,102 | $63,119 |
| 2022 | $6,135 | $62,066 | $6,277 | $55,789 |
| 2021 | $5,843 | $58,033 | $5,869 | $52,164 |
| 2020 | $5,677 | $56,125 | $5,676 | $50,449 |
| 2019 | $5,407 | $52,405 | $5,300 | $47,105 |
| 2018 | $5,007 | $48,210 | $4,876 | $43,334 |
| 2017 | $4,790 | $45,697 | $4,622 | $41,075 |
| 2016 | $4,671 | $43,500 | $4,400 | $39,100 |
| 2015 | $4,406 | $41,700 | $4,200 | $37,500 |
| 2014 | $4,406 | $39,700 | $4,000 | $35,700 |
| 2013 | $4,406 | $39,700 | $4,000 | $35,700 |
Source: Public Records
Map
Nearby Homes
- 156 Winston Dr
- 168 Winston Dr
- 151 E Boughton Rd
- BUILDING 14 Ridge Ln
- 245 Porter Ln
- 460 Ridge Ln
- 462 Ridge Ln
- 456 Ridge Ln
- 424 Van Gogh Cir Unit 1
- 555 Monroe Rd
- 490 Ridge Ln
- 417 Monet Cir
- 458 Wyeth Cir
- 419 Lakeview Cir
- 369 Lakeview Cir
- 7 Purchase Ct
- 153 Camelot Way
- 354 Aaron Ln
- 6 Charlestown Ct
- 421 N Ashbury Ave
- 533 Thomas Rd
- 533 Thomas Rd
- 531 Thomas Rd Unit 3
- 535 Thomas Rd
- 535 Thomas Rd Unit 535
- 537 Thomas Rd
- 539 Thomas Rd Unit 3
- 541 Thomas Rd
- 529 Julie Rd
- 526 Julie Rd
- 527 Julie Rd
- 543 Thomas Rd Unit 3
- 525 Julie Rd
- 127 Jerome Ln Unit 3
- 524 Julie Rd
- 545 Thomas Rd Unit 3
- 523 Julie Rd
- 128 Jerome Ln Unit 3
- 528 Thomas Rd
- 131 Jerome Ln Unit 3
Your Personal Tour Guide
Ask me questions while you tour the home.