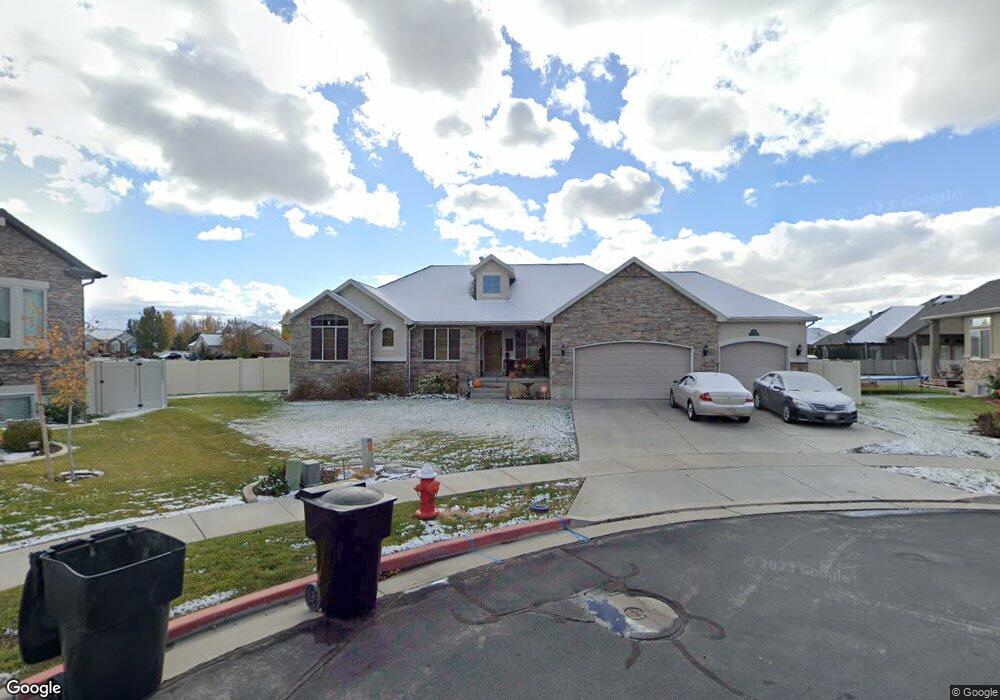
533 W 2810 S Syracuse, UT 84075
Estimated Value: $607,000 - $647,615
3
Beds
2
Baths
3,210
Sq Ft
$198/Sq Ft
Est. Value
About This Home
This home is located at 533 W 2810 S, Syracuse, UT 84075 and is currently estimated at $634,154, approximately $197 per square foot. 533 W 2810 S is a home located in Davis County with nearby schools including Bluff Ridge Elementary, Legacy Junior High School, and Clearfield High School.
Ownership History
Date
Name
Owned For
Owner Type
Purchase Details
Closed on
May 4, 2007
Sold by
Destination Homes Inc
Bought by
King Brian and King Rochelle
Current Estimated Value
Home Financials for this Owner
Home Financials are based on the most recent Mortgage that was taken out on this home.
Original Mortgage
$258,320
Outstanding Balance
$156,187
Interest Rate
6.15%
Mortgage Type
Purchase Money Mortgage
Estimated Equity
$477,967
Purchase Details
Closed on
Nov 7, 2005
Sold by
Discovery Development Llc
Bought by
Destination Homes Inc
Home Financials for this Owner
Home Financials are based on the most recent Mortgage that was taken out on this home.
Original Mortgage
$2,227,500
Interest Rate
5.9%
Mortgage Type
Purchase Money Mortgage
Purchase Details
Closed on
Oct 28, 2005
Sold by
Chournos Lanse
Bought by
Discovery Development Llc
Home Financials for this Owner
Home Financials are based on the most recent Mortgage that was taken out on this home.
Original Mortgage
$2,227,500
Interest Rate
5.9%
Mortgage Type
Purchase Money Mortgage
Create a Home Valuation Report for This Property
The Home Valuation Report is an in-depth analysis detailing your home's value as well as a comparison with similar homes in the area
Home Values in the Area
Average Home Value in this Area
Purchase History
| Date | Buyer | Sale Price | Title Company |
|---|---|---|---|
| King Brian | -- | Bonneville Superior Title Co | |
| Destination Homes Inc | -- | Bonneville Title Company | |
| Discovery Development Llc | -- | Founders Title Co |
Source: Public Records
Mortgage History
| Date | Status | Borrower | Loan Amount |
|---|---|---|---|
| Open | King Brian | $258,320 | |
| Previous Owner | Destination Homes Inc | $2,227,500 |
Source: Public Records
Tax History Compared to Growth
Tax History
| Year | Tax Paid | Tax Assessment Tax Assessment Total Assessment is a certain percentage of the fair market value that is determined by local assessors to be the total taxable value of land and additions on the property. | Land | Improvement |
|---|---|---|---|---|
| 2025 | $3,329 | $321,200 | $135,456 | $185,744 |
| 2024 | $3,126 | $303,600 | $116,203 | $187,397 |
| 2023 | $2,966 | $525,000 | $161,672 | $363,328 |
| 2022 | $3,095 | $300,300 | $92,484 | $207,816 |
| 2021 | $2,783 | $418,000 | $137,151 | $280,849 |
| 2020 | $2,510 | $365,000 | $117,368 | $247,632 |
| 2019 | $2,389 | $343,000 | $117,301 | $225,699 |
| 2018 | $2,232 | $318,000 | $111,895 | $206,105 |
| 2016 | $2,019 | $150,865 | $42,853 | $108,012 |
| 2015 | $2,118 | $150,755 | $42,853 | $107,902 |
| 2014 | $2,013 | $145,973 | $42,853 | $103,120 |
| 2013 | -- | $146,710 | $38,837 | $107,873 |
Source: Public Records
Map
Nearby Homes