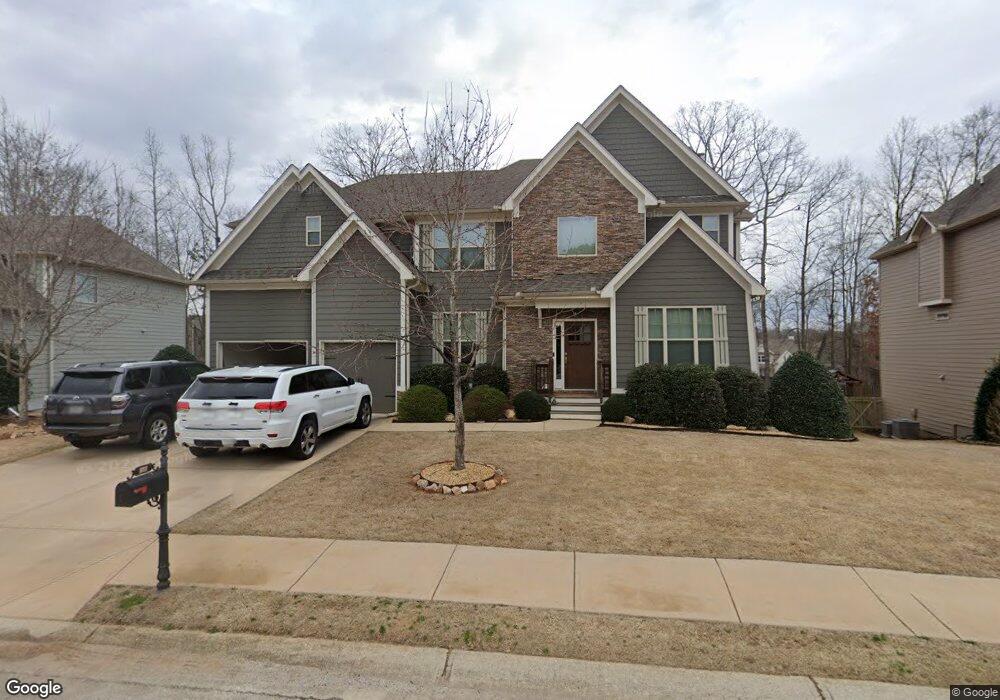
533 Widgeon Way Unit 292 Jefferson, GA 30549
Estimated Value: $655,127 - $676,000
5
Beds
3
Baths
2,585
Sq Ft
$257/Sq Ft
Est. Value
About This Home
This home is located at 533 Widgeon Way Unit 292, Jefferson, GA 30549 and is currently estimated at $664,282, approximately $256 per square foot. 533 Widgeon Way Unit 292 is a home located in Jackson County with nearby schools including Jefferson Elementary School, Jefferson Academy, and Jefferson Middle School.
Ownership History
Date
Name
Owned For
Owner Type
Purchase Details
Closed on
Jun 6, 2024
Sold by
Wascher Tabitha
Bought by
Wellen Adam J
Current Estimated Value
Home Financials for this Owner
Home Financials are based on the most recent Mortgage that was taken out on this home.
Original Mortgage
$330,000
Outstanding Balance
$325,555
Interest Rate
7.09%
Mortgage Type
New Conventional
Estimated Equity
$338,727
Purchase Details
Closed on
May 22, 2015
Sold by
Lfw Mallard Llc
Bought by
Wascher Tabitha and Wascher James T
Home Financials for this Owner
Home Financials are based on the most recent Mortgage that was taken out on this home.
Original Mortgage
$243,000
Interest Rate
3.77%
Mortgage Type
New Conventional
Purchase Details
Closed on
Sep 26, 2013
Sold by
Meridian Jefferson Llc
Bought by
Lfw Mallard Llc
Purchase Details
Closed on
Sep 11, 2013
Sold by
Westridge Partners Iii Llc
Bought by
Meridian Jefferson Llc
Create a Home Valuation Report for This Property
The Home Valuation Report is an in-depth analysis detailing your home's value as well as a comparison with similar homes in the area
Home Values in the Area
Average Home Value in this Area
Purchase History
| Date | Buyer | Sale Price | Title Company |
|---|---|---|---|
| Wellen Adam J | $630,000 | -- | |
| Wellen Adam J | $630,000 | -- | |
| Wascher Tabitha | $270,000 | -- | |
| Lfw Mallard Llc | $750,000 | -- | |
| Meridian Jefferson Llc | $410,000 | -- |
Source: Public Records
Mortgage History
| Date | Status | Borrower | Loan Amount |
|---|---|---|---|
| Open | Wellen Adam J | $330,000 | |
| Closed | Wellen Adam J | $330,000 | |
| Previous Owner | Wascher Tabitha | $243,000 |
Source: Public Records
Tax History Compared to Growth
Tax History
| Year | Tax Paid | Tax Assessment Tax Assessment Total Assessment is a certain percentage of the fair market value that is determined by local assessors to be the total taxable value of land and additions on the property. | Land | Improvement |
|---|---|---|---|---|
| 2024 | $6,805 | $247,192 | $28,400 | $218,792 |
| 2023 | $6,799 | $214,516 | $28,400 | $186,116 |
| 2022 | $5,660 | $176,636 | $28,400 | $148,236 |
| 2021 | $5,126 | $157,200 | $18,000 | $139,200 |
| 2020 | $4,493 | $128,840 | $18,000 | $110,840 |
| 2019 | $4,646 | $131,240 | $18,000 | $113,240 |
| 2018 | $4,042 | $113,400 | $18,000 | $95,400 |
| 2017 | $3,760 | $103,417 | $18,000 | $85,417 |
| 2016 | $3,764 | $102,417 | $17,000 | $85,417 |
| 2015 | $2,418 | $65,541 | $8,400 | $57,141 |
| 2014 | $224 | $8,400 | $8,400 | $0 |
| 2013 | -- | $6,000 | $6,000 | $0 |
Source: Public Records
Map
Nearby Homes
- 533 Widgeon Way
- 748 Hawkins Creek Dr
- 150 Merganser Dr
- 1168 Ruddy Duck Dr
- 1053 Ruddy Duck Dr
- 864 Hawkins Creek Dr
- 1023 Ruddy Duck Dr
- 1233 Ruddy Duck Dr
- 1234 Oconee River Lot 4 Dr
- 55 Grand Oak Dr
- 105 Grand Oak Dr
- 1234 Oconee River Dr Unit LOT 4
- 42 Brant Cir
- 357 Brant Cir
- 0 Panther Dr Unit CL343172
- 0 Panther Dr Unit 10638263
- 816 Mimosa Way
- 584 Jefferson Walk Cir
- 68 Suwannee Way
- 529 Widgeon Way Unit 291
- 529 Widgeon Way
- 537 Widgeon Way
- 780 Hawkins Creek Dr
- 525 Widgeon Way
- 518 Widgeon Way Unit 287
- 518 Widgeon Way
- 541 Widgeon Way
- 772 Hawkins Creek Dr Unit 323
- 772 Hawkins Creek Dr
- 788 Hawkins Creek Dr
- 522 Widgeon Way
- 796 Hawkins Creek Dr
- 756 Hawkins Creek Dr Unit 324
- 756 Hawkins Creek Dr
- 521 Widgeon Way
- 545 Widgeon Way
- 812 Hawkins Creek Dr
- 534 Widgeon Way
- 820 Hawkins Creek Dr