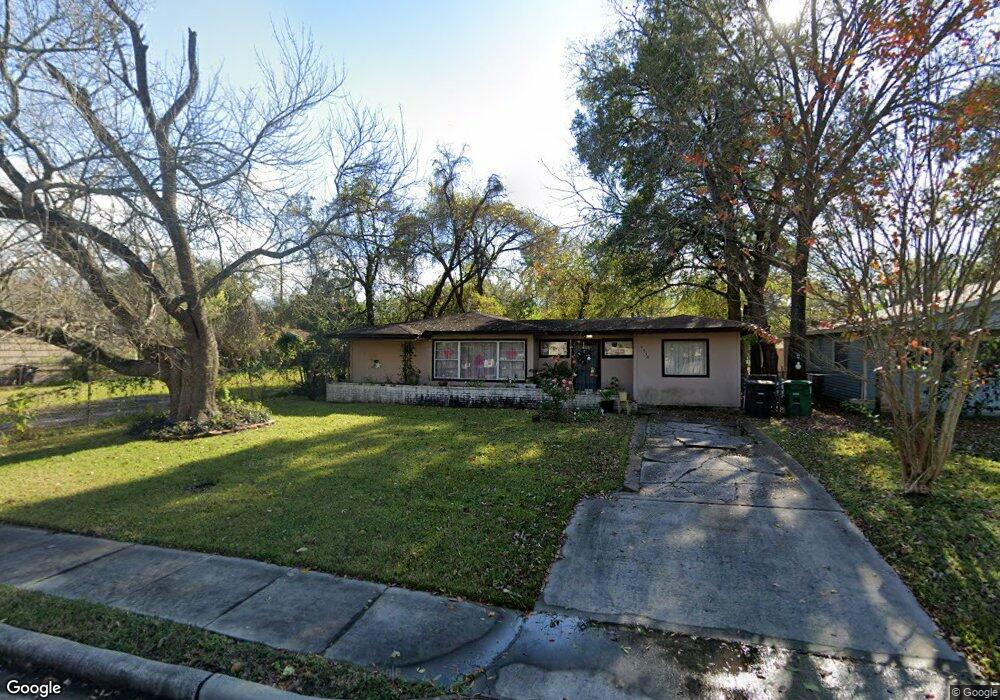
5330 Dewberry St Houston, TX 77021
OST-South Union NeighborhoodEstimated Value: $212,035 - $239,000
3
Beds
2
Baths
1,780
Sq Ft
$126/Sq Ft
Est. Value
About This Home
This home is located at 5330 Dewberry St, Houston, TX 77021 and is currently estimated at $224,509, approximately $126 per square foot. 5330 Dewberry St is a home located in Harris County with nearby schools including Hartsfield Elementary Animal and Environmental Sciences Magnet, Cullen Middle School, and Yates High School.
Ownership History
Date
Name
Owned For
Owner Type
Purchase Details
Closed on
Sep 30, 2010
Sold by
Fannie Mae
Bought by
Pfirman Richard L
Current Estimated Value
Purchase Details
Closed on
Mar 3, 2010
Sold by
Matthews Stanley
Bought by
Federal National Mortgage Association
Purchase Details
Closed on
Nov 13, 2003
Sold by
Jakrac Aspen Llp
Bought by
Matthews Stanley
Home Financials for this Owner
Home Financials are based on the most recent Mortgage that was taken out on this home.
Original Mortgage
$75,000
Interest Rate
5.81%
Mortgage Type
Purchase Money Mortgage
Purchase Details
Closed on
Aug 12, 2003
Sold by
Smith Rachel
Bought by
Jakrak Aspen Llp
Purchase Details
Closed on
Mar 8, 1994
Sold by
French Dale
Bought by
Smith Rachel
Home Financials for this Owner
Home Financials are based on the most recent Mortgage that was taken out on this home.
Original Mortgage
$22,000
Interest Rate
6.95%
Mortgage Type
Seller Take Back
Create a Home Valuation Report for This Property
The Home Valuation Report is an in-depth analysis detailing your home's value as well as a comparison with similar homes in the area
Home Values in the Area
Average Home Value in this Area
Purchase History
| Date | Buyer | Sale Price | Title Company |
|---|---|---|---|
| Pfirman Richard L | -- | Excel Title Group | |
| Federal National Mortgage Association | $59,285 | None Available | |
| Matthews Stanley | -- | Stewart Title Company | |
| Jakrak Aspen Llp | -- | Stewart Title Co | |
| Smith Rachel | -- | -- |
Source: Public Records
Mortgage History
| Date | Status | Borrower | Loan Amount |
|---|---|---|---|
| Previous Owner | Matthews Stanley | $75,000 | |
| Previous Owner | Smith Rachel | $22,000 |
Source: Public Records
Tax History Compared to Growth
Tax History
| Year | Tax Paid | Tax Assessment Tax Assessment Total Assessment is a certain percentage of the fair market value that is determined by local assessors to be the total taxable value of land and additions on the property. | Land | Improvement |
|---|---|---|---|---|
| 2025 | $2,898 | $129,234 | $96,720 | $32,514 |
| 2024 | $2,898 | $138,509 | $96,720 | $41,789 |
| 2023 | $2,898 | $135,981 | $96,720 | $39,261 |
| 2022 | $2,832 | $100,000 | $88,660 | $11,340 |
| 2021 | $2,453 | $105,263 | $64,480 | $40,783 |
| 2020 | $2,382 | $93,914 | $40,300 | $53,614 |
| 2019 | $2,150 | $81,269 | $34,255 | $47,014 |
| 2018 | $652 | $25,771 | $24,180 | $1,591 |
| 2017 | $681 | $25,771 | $24,180 | $1,591 |
| 2016 | $1,454 | $55,000 | $24,180 | $30,820 |
| 2015 | $617 | $62,821 | $24,180 | $38,641 |
| 2014 | $617 | $24,000 | $20,150 | $3,850 |
Source: Public Records
Map
Nearby Homes
- 5259 Perry St
- 5251 Perry St
- 5322 Dewberry St
- 5251 Dewberry St
- 5338 Keystone St
- 5224 Dewberry St
- 5219 Cosby St
- 5244 Enyart St
- 5210 Enyart St
- 6031 Beekman Rd
- 5941 South Loop E Unit 104
- 5215 Kingsbury St
- 5218 Kelso St
- 6527 Beekman Rd
- 4611 Dewberry St
- 5601 Malmedy Rd
- 5111 Cosby St
- 5503-5515 Griggs Rd
- 5023 Cosby St
- 5022 Balkin St
- 5326 Dewberry St
- 5338 Dewberry St
- 6135 Cavanaugh St
- 6131 Cavanaugh St
- 6120 Beekman Rd
- 5318 Dewberry St
- 6127 Cavanaugh St
- 6139 Cavanaugh St
- 6124 Beekman Rd
- 5331 Dewberry St
- 5327 Dewberry St
- 5335 Dewberry St
- 6110 Beekman Rd
- 6123 Cavanaugh St
- 5323 Dewberry St
- 5339 Dewberry St
- 5314 Dewberry St
- 6143 Cavanaugh St
- 5319 Dewberry St
- 5343 Dewberry St