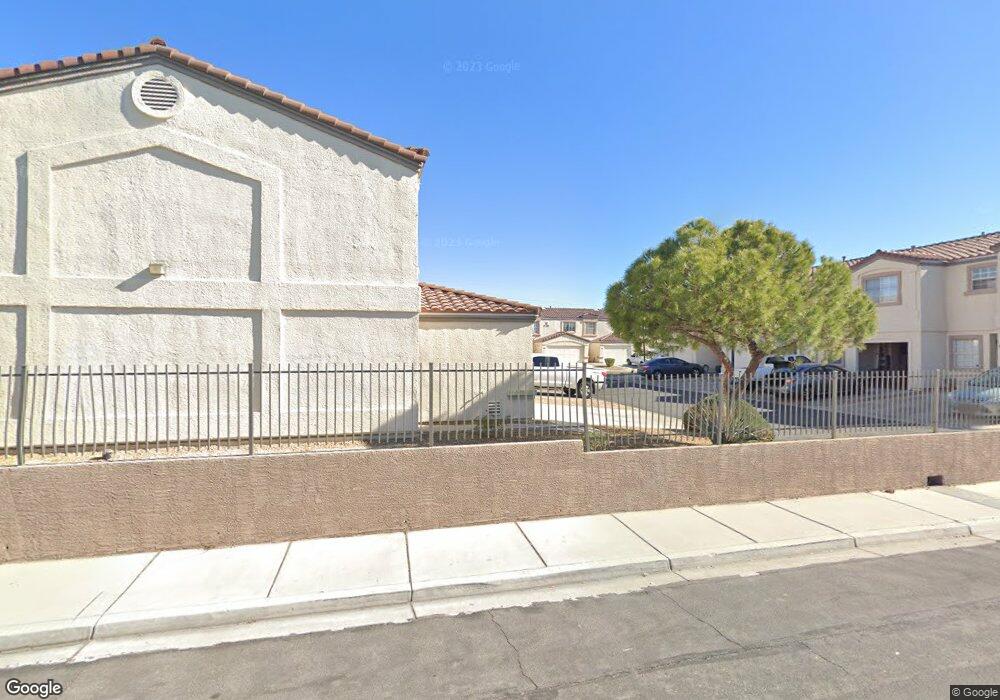
5330 E Charleston Blvd Unit 134 Las Vegas, NV 89142
Estimated Value: $250,000 - $279,000
3
Beds
3
Baths
1,156
Sq Ft
$228/Sq Ft
Est. Value
About This Home
This home is located at 5330 E Charleston Blvd Unit 134, Las Vegas, NV 89142 and is currently estimated at $263,872, approximately $228 per square foot. 5330 E Charleston Blvd Unit 134 is a home located in Clark County with nearby schools including Richard J. Rundle Elementary School, Charlotte & Jerry Keller Elementary School, and Duane D. Keller Middle School.
Ownership History
Date
Name
Owned For
Owner Type
Purchase Details
Closed on
Aug 28, 2024
Sold by
Lopez Jason Hernandez
Bought by
Martinez Saul Alejandro Ri and Villalobos Vibiana Judith
Current Estimated Value
Home Financials for this Owner
Home Financials are based on the most recent Mortgage that was taken out on this home.
Original Mortgage
$8,100
Outstanding Balance
$5,281
Interest Rate
6.47%
Mortgage Type
New Conventional
Estimated Equity
$258,591
Purchase Details
Closed on
Mar 1, 2022
Sold by
Sina Sua Rakel
Bought by
Lopez-Hernandez Jason
Purchase Details
Closed on
Feb 16, 2021
Sold by
Omas Grandchildren Trust
Bought by
Lopez Hernandez Jason and Sua Rakel Sina
Home Financials for this Owner
Home Financials are based on the most recent Mortgage that was taken out on this home.
Original Mortgage
$162,450
Interest Rate
2.7%
Mortgage Type
New Conventional
Purchase Details
Closed on
Aug 25, 2009
Sold by
Us Bank Na
Bought by
King Teri and Omas Grandchildren Trusts
Purchase Details
Closed on
Apr 2, 2009
Sold by
Morales Hernan and Martinez Itza
Bought by
Us Bank Na and Firstar Bank Na
Purchase Details
Closed on
Oct 30, 2006
Sold by
Rico Alana P and Rico Gerardo L
Bought by
Morales Hernan and Martinez Itza
Home Financials for this Owner
Home Financials are based on the most recent Mortgage that was taken out on this home.
Original Mortgage
$156,400
Interest Rate
6.37%
Mortgage Type
Purchase Money Mortgage
Purchase Details
Closed on
Jan 30, 2002
Sold by
Oryniak Gary
Bought by
Rico Gerardo L and Rico Alana P
Home Financials for this Owner
Home Financials are based on the most recent Mortgage that was taken out on this home.
Original Mortgage
$87,115
Interest Rate
7.13%
Mortgage Type
Purchase Money Mortgage
Purchase Details
Closed on
Oct 15, 2001
Sold by
Hud
Bought by
Oryniak Gary
Purchase Details
Closed on
Feb 27, 2001
Sold by
Chase Manhattan Mtg Corp
Bought by
Hud
Purchase Details
Closed on
Jan 11, 2001
Sold by
Shull Randy W
Bought by
Chase Manhattan Mtg Corp
Purchase Details
Closed on
Apr 21, 1998
Sold by
Saxton Inc
Bought by
Shull Randy W
Home Financials for this Owner
Home Financials are based on the most recent Mortgage that was taken out on this home.
Original Mortgage
$84,325
Interest Rate
7.13%
Mortgage Type
FHA
Create a Home Valuation Report for This Property
The Home Valuation Report is an in-depth analysis detailing your home's value as well as a comparison with similar homes in the area
Home Values in the Area
Average Home Value in this Area
Purchase History
| Date | Buyer | Sale Price | Title Company |
|---|---|---|---|
| Martinez Saul Alejandro Ri | $270,000 | Old Republic Title | |
| Lopez-Hernandez Jason | -- | New Title Company Name | |
| Lopez Hernandez Jason | $171,000 | Clear Title Company | |
| King Teri | $42,500 | Nevada Title Las Vegas | |
| Us Bank Na | $61,100 | Fidelity National Default So | |
| Morales Hernan | $195,500 | Old Republic Title Co Of Nv | |
| Rico Gerardo L | $91,700 | United Title | |
| Oryniak Gary | $72,000 | First American Title Co | |
| Hud | -- | First American Title Co | |
| Chase Manhattan Mtg Corp | $91,278 | First American Title Co | |
| Shull Randy W | $87,000 | First American Title Co |
Source: Public Records
Mortgage History
| Date | Status | Borrower | Loan Amount |
|---|---|---|---|
| Open | Martinez Saul Alejandro Ri | $8,100 | |
| Open | Martinez Saul Alejandro Ri | $261,900 | |
| Previous Owner | Lopez Hernandez Jason | $162,450 | |
| Previous Owner | Morales Hernan | $156,400 | |
| Previous Owner | Rico Gerardo L | $87,115 | |
| Previous Owner | Shull Randy W | $84,325 |
Source: Public Records
Tax History Compared to Growth
Tax History
| Year | Tax Paid | Tax Assessment Tax Assessment Total Assessment is a certain percentage of the fair market value that is determined by local assessors to be the total taxable value of land and additions on the property. | Land | Improvement |
|---|---|---|---|---|
| 2025 | $585 | $57,085 | $18,900 | $38,185 |
| 2024 | $568 | $57,085 | $18,900 | $38,185 |
| 2023 | $415 | $58,229 | $23,100 | $35,129 |
| 2022 | $578 | $52,264 | $18,900 | $33,364 |
| 2021 | $536 | $45,196 | $17,850 | $27,346 |
| 2020 | $495 | $45,671 | $17,150 | $28,521 |
| 2019 | $463 | $42,326 | $14,000 | $28,326 |
| 2018 | $442 | $34,533 | $7,350 | $27,183 |
| 2017 | $904 | $30,834 | $5,250 | $25,584 |
| 2016 | $415 | $32,395 | $5,250 | $27,145 |
| 2015 | $413 | $25,687 | $3,850 | $21,837 |
| 2014 | $401 | $13,541 | $2,450 | $11,091 |
Source: Public Records
Map
Nearby Homes
- 5330 E Charleston Blvd Unit 2
- 5330 E Charleston Blvd Unit 113
- 140 Sir David Way
- 0 E Charleston Blvd
- 1200 Pleasant Brook St
- 153 Sir Thomas Dr
- 1224 Pleasant Brook St
- 136 Sir George Dr
- 111 Sir Arthur Dr
- 130 Bel Port Dr Unit 133
- 179 Sir George Dr
- 147 N Christy Ln
- 5564 Orchard Ln Unit 133
- 5353 Hollow Brook Ave
- 5600 Orchard Ln
- 280 Sir Phillip St
- 5583 Orchard Ln Unit 152
- 332 Sir Jeffery Cir
- 1361 Elaine Dr
- 360 Sir Richard Dr E
- 5330 E Charleston Blvd
- 5330 E Charleston Blvd Unit 148
- 5330 E Charleston Blvd Unit 4
- 5330 E Charleston Blvd Unit 22
- 5330 E Charleston Blvd Unit 129
- 5330 E Charleston Blvd Unit 126
- 5330 E Charleston Blvd Unit 122
- 5330 E Charleston Blvd Unit 107
- 5330 E Charleston Blvd Unit 41
- 5330 E Charleston Blvd Unit 105
- 5330 E Charleston Blvd Unit 7
- 5330 E Charleston Blvd Unit 74
- 5330 E Charleston Blvd Unit 17
- 5330 E Charleston Blvd Unit 145
- 5330 E Charleston Blvd Unit 67
- 5330 E Charleston Blvd Unit 102
- 5330 E Charleston Blvd Unit 69
- 5330 E Charleston Blvd Unit 116
- 5330 E Charleston Blvd Unit 81
- 5330 E Charleston Blvd Unit 59