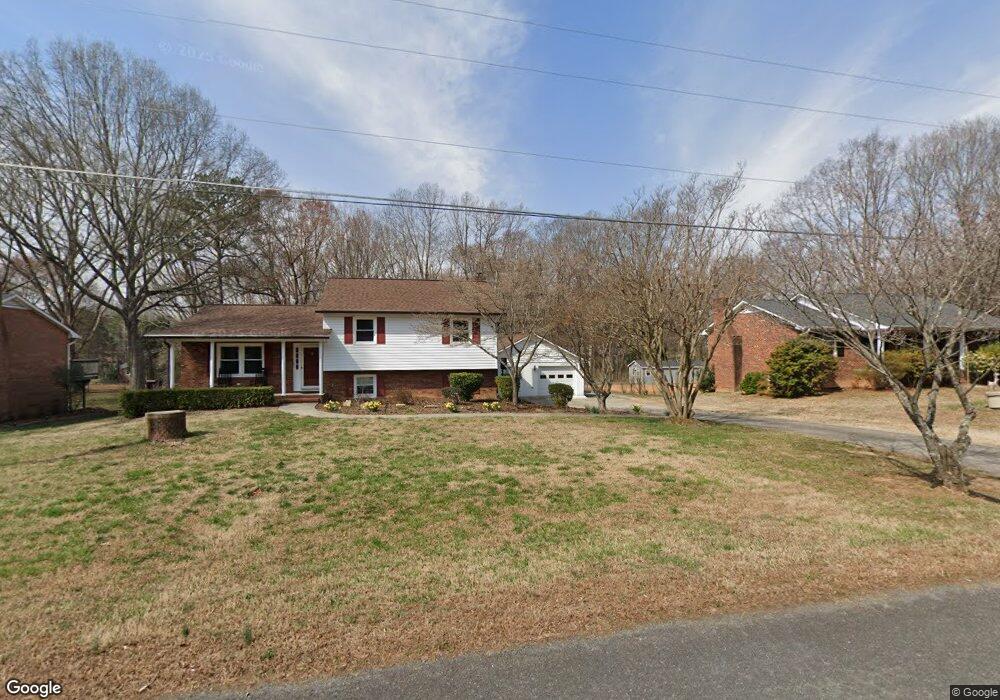
5330 Nestleway Dr Clemmons, NC 27012
Estimated Value: $290,299 - $308,000
3
Beds
2
Baths
1,619
Sq Ft
$185/Sq Ft
Est. Value
About This Home
This home is located at 5330 Nestleway Dr, Clemmons, NC 27012 and is currently estimated at $300,075, approximately $185 per square foot. 5330 Nestleway Dr is a home located in Forsyth County with nearby schools including Ward Elementary School, Clemmons Middle School, and West Forsyth High.
Ownership History
Date
Name
Owned For
Owner Type
Purchase Details
Closed on
Nov 15, 2017
Sold by
Buckler John Daniel
Bought by
Nunez Ubaldo and Betancourt Gleibis
Current Estimated Value
Home Financials for this Owner
Home Financials are based on the most recent Mortgage that was taken out on this home.
Original Mortgage
$165,656
Outstanding Balance
$138,812
Interest Rate
3.85%
Mortgage Type
New Conventional
Estimated Equity
$161,263
Purchase Details
Closed on
Aug 17, 2009
Sold by
Phillips Doris J
Bought by
Buckler John Daniel
Home Financials for this Owner
Home Financials are based on the most recent Mortgage that was taken out on this home.
Original Mortgage
$124,800
Interest Rate
5.26%
Mortgage Type
Purchase Money Mortgage
Purchase Details
Closed on
Nov 30, 2004
Sold by
Phillips Michael H
Bought by
Phillips Doris Jean
Home Financials for this Owner
Home Financials are based on the most recent Mortgage that was taken out on this home.
Original Mortgage
$94,000
Interest Rate
4.25%
Mortgage Type
Purchase Money Mortgage
Create a Home Valuation Report for This Property
The Home Valuation Report is an in-depth analysis detailing your home's value as well as a comparison with similar homes in the area
Home Values in the Area
Average Home Value in this Area
Purchase History
| Date | Buyer | Sale Price | Title Company |
|---|---|---|---|
| Nunez Ubaldo | $164,000 | None Available | |
| Buckler John Daniel | $156,000 | None Available | |
| Phillips Doris Jean | $1,000 | -- |
Source: Public Records
Mortgage History
| Date | Status | Borrower | Loan Amount |
|---|---|---|---|
| Open | Nunez Ubaldo | $165,656 | |
| Previous Owner | Buckler John Daniel | $124,800 | |
| Previous Owner | Phillips Doris Jean | $94,000 |
Source: Public Records
Tax History Compared to Growth
Tax History
| Year | Tax Paid | Tax Assessment Tax Assessment Total Assessment is a certain percentage of the fair market value that is determined by local assessors to be the total taxable value of land and additions on the property. | Land | Improvement |
|---|---|---|---|---|
| 2025 | $1,248 | $258,400 | $44,000 | $214,400 |
| 2024 | $1,216 | $163,900 | $35,500 | $128,400 |
| 2023 | $1,216 | $163,900 | $35,500 | $128,400 |
| 2022 | $1,216 | $163,900 | $35,500 | $128,400 |
| 2021 | $1,193 | $160,800 | $35,500 | $125,300 |
| 2020 | $1,099 | $135,600 | $30,000 | $105,600 |
| 2019 | $1,113 | $135,600 | $30,000 | $105,600 |
| 2018 | $1,067 | $135,600 | $30,000 | $105,600 |
| 2016 | $1,035 | $130,846 | $30,000 | $100,846 |
| 2015 | $1,035 | $130,846 | $30,000 | $100,846 |
| 2014 | $1,003 | $130,846 | $30,000 | $100,846 |
Source: Public Records
Map
Nearby Homes
- 6067 Frye Bridge Rd
- 5269 Sunny Brook Ct
- 6049 Frye Bridge Rd
- 5246 Sunny Brook Ct
- Torino Plan at Salem Brooke
- Promenade Plan at Salem Brooke
- Portico Plan at Salem Brooke
- 6039 Sunny Brook Dr
- 6310 Hampton Knoll Rd
- 5070 Windsbury Ridge Rd
- 6112 Charlene Dr
- 6947 Orchard Path Dr
- 6045 Stone Bluff Dr
- 6028 Stone Bluff Dr
- 5117 Ivy Trace
- 6482 Bluestone Park Dr
- 5161 Quail Forest Dr
- 165 Stonburg Rd
- 5260 Vineleaf
- 5220 Vineleaf Ct
- 5340 Nestleway Dr
- 5320 Nestleway Dr
- 5350 Nestleway Dr
- 5310 Nestleway Dr
- 5339 Nestleway Dr
- 5300 Nestleway Dr
- 6141 Frye Bridge Rd
- 5349 Nestleway Dr
- 5360 Nestleway Dr
- 6111 Farrior Dr
- 5359 Nestleway Dr
- 6060 Farrior Dr
- 5370 Nestleway Dr
- 6120 Farrior Dr
- 5305 Mapleton St
- 6197 Frye Bridge Rd
- 5369 Nestleway Dr
- 6140 Frye Bridge Rd
- 5380 Nestleway Dr
- 6065 Farrior Dr