Estimated Value: $274,000 - $295,000
--
Bed
1
Bath
1,228
Sq Ft
$231/Sq Ft
Est. Value
About This Home
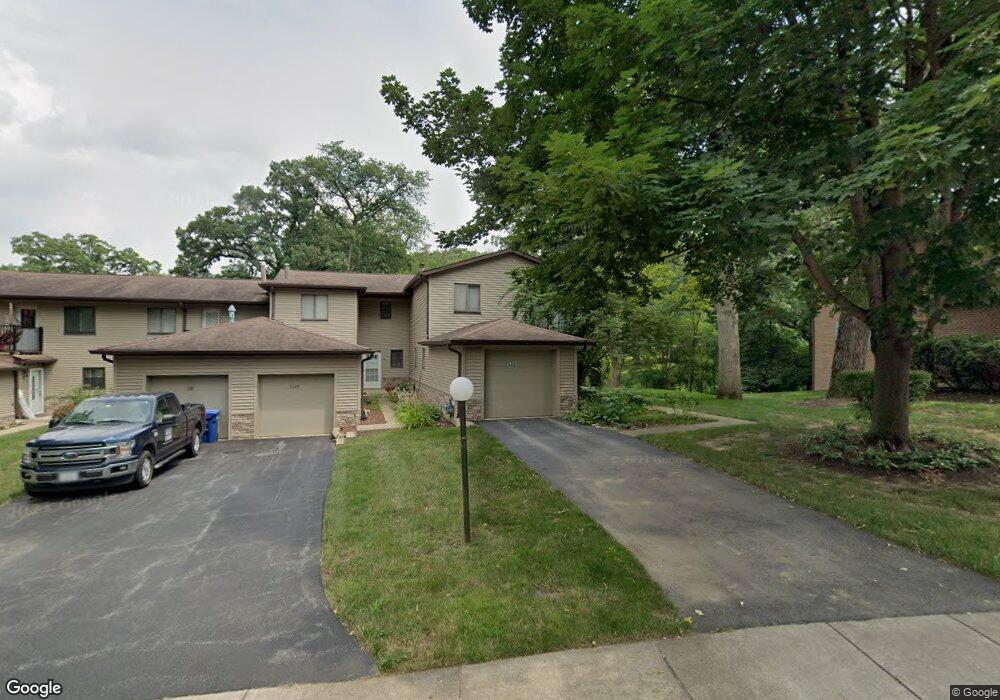
This home is located at 5331 Newport Dr Unit 6, Lisle, IL 60532 and is currently estimated at $283,658, approximately $230 per square foot. 5331 Newport Dr Unit 6 is a home located in DuPage County with nearby schools including Lisle Elementary School, Lisle Jr High School, and Lisle High School.
Ownership History
Date
Name
Owned For
Owner Type
Purchase Details
Closed on
May 30, 2000
Sold by
Simeral Judith
Bought by
Wilkins Lisa M
Current Estimated Value
Home Financials for this Owner
Home Financials are based on the most recent Mortgage that was taken out on this home.
Original Mortgage
$126,000
Outstanding Balance
$47,259
Interest Rate
9.12%
Estimated Equity
$236,399
Purchase Details
Closed on
Dec 8, 1998
Sold by
Paries Lee A
Bought by
Simeral Judith
Home Financials for this Owner
Home Financials are based on the most recent Mortgage that was taken out on this home.
Original Mortgage
$75,000
Interest Rate
7.02%
Purchase Details
Closed on
Feb 19, 1998
Sold by
Brodie Terri L
Bought by
Paries Lee A
Home Financials for this Owner
Home Financials are based on the most recent Mortgage that was taken out on this home.
Original Mortgage
$104,652
Interest Rate
6.99%
Mortgage Type
FHA
Create a Home Valuation Report for This Property
The Home Valuation Report is an in-depth analysis detailing your home's value as well as a comparison with similar homes in the area
Home Values in the Area
Average Home Value in this Area
Purchase History
| Date | Buyer | Sale Price | Title Company |
|---|---|---|---|
| Wilkins Lisa M | $126,000 | Law Title Pick Up | |
| Simeral Judith | $110,000 | First American Title | |
| Paries Lee A | $105,000 | -- |
Source: Public Records
Mortgage History
| Date | Status | Borrower | Loan Amount |
|---|---|---|---|
| Open | Wilkins Lisa M | $126,000 | |
| Previous Owner | Simeral Judith | $75,000 | |
| Previous Owner | Paries Lee A | $104,652 |
Source: Public Records
Tax History Compared to Growth
Tax History
| Year | Tax Paid | Tax Assessment Tax Assessment Total Assessment is a certain percentage of the fair market value that is determined by local assessors to be the total taxable value of land and additions on the property. | Land | Improvement |
|---|---|---|---|---|
| 2024 | $4,535 | $70,388 | $10,157 | $60,231 |
| 2023 | $4,318 | $64,240 | $9,270 | $54,970 |
| 2022 | $4,259 | $62,430 | $9,010 | $53,420 |
| 2021 | $4,125 | $60,070 | $8,670 | $51,400 |
| 2020 | $3,949 | $58,990 | $8,510 | $50,480 |
| 2019 | $3,875 | $56,440 | $8,140 | $48,300 |
| 2018 | $3,368 | $49,940 | $7,200 | $42,740 |
| 2017 | $3,327 | $48,260 | $6,960 | $41,300 |
| 2016 | $3,240 | $46,520 | $6,710 | $39,810 |
| 2015 | $3,182 | $43,810 | $6,320 | $37,490 |
| 2014 | $3,209 | $43,810 | $6,320 | $37,490 |
| 2013 | $3,552 | $48,780 | $7,030 | $41,750 |
Source: Public Records
Map
Nearby Homes
- 5305 Newport Dr Unit 3
- 1874 Portsmouth Dr Unit 66C
- 1822 Portsmouth Dr Unit 2
- 2007 Ohio St
- 6269 Lafond Cir
- 6222 Lafond Cir
- 6224 Lafond Cir
- 6259 Lafond Cir
- 6210 Rivers Edge Dr
- 6225 Rivers Edge Dr
- 6226 Lafond Cir
- 6230 Lafond Cir
- 6279 Lee Ct
- 6284 Lee Ct
- 6260 Lafond Cir
- 25W054 (Lot 4) Burlington Ave
- 6282 Lee Ct
- 6280 Lee Ct
- 6235 Lafond Cir
- 6219 Rivers Edge Dr
- 5329 Newport Dr Unit 5
- 5327 Newport Dr
- 5325 Newport Dr Unit 3
- 5347 Newport Dr Unit 48D
- 5345 Newport Dr Unit 47C
- 5343 Newport Dr Unit 44B
- 5357 Newport Dr Unit 45D
- 5357 Newport Dr Unit D
- 5321 Newport Dr Unit 1
- 5341 Newport Dr Unit 43A
- 5355 Newport Dr Unit C
- 5353 Newport Dr Unit 41B
- 5363 Newport Dr Unit 32B
- 5363 Newport Dr Unit 42A
- 5363 Newport Dr Unit B
- 5363 Newport Dr Unit 5363
- 1897 Portsmouth Dr Unit 4
- 1897 Portsmouth Dr Unit D
- 1893 Portsmouth Dr Unit 1B
- 1895 Portsmouth Dr Unit C